Data
813,626 items of data are available, covering 90,919 participants.
Defined-instances run from 0 to 3, labelled using Instancing
2.
Array indices run from 0 to 15.
Units of measurement are milliseconds.
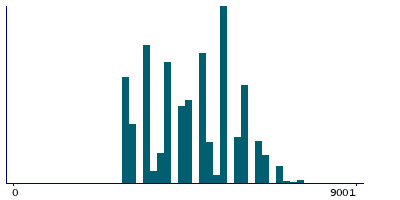
| Maximum | 102563 |
| Decile 9 | 6006 |
| Decile 8 | 5507 |
| Decile 7 | 5500 |
| Decile 6 | 5007 |
| Median | 4509 |
| Decile 4 | 4500 |
| Decile 3 | 4000 |
| Decile 2 | 3510 |
| Decile 1 | 3011 |
| Minimum | 1139 |
|
|
- There are 162 distinct values.
- Mean = 4680.27
- Std.dev = 1123.24
- 31 items above graph maximum of 9001
|
3 Instances
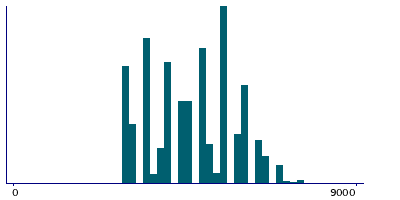
Instance 0 : Initial assessment visit (2006-2010) at which participants were recruited and consent given
51,631 participants, 419,092 items
| Maximum | 102563 |
| Decile 9 | 6000 |
| Decile 8 | 5500 |
| Decile 7 | 5500 |
| Decile 6 | 5000 |
| Median | 4500 |
| Decile 4 | 4500 |
| Decile 3 | 4000 |
| Decile 2 | 3500 |
| Decile 1 | 3000 |
| Minimum | 1859 |
|
|
- There are 85 distinct values.
- Mean = 4662.63
- Std.dev = 1130.66
- 13 items above graph maximum of 9000
|
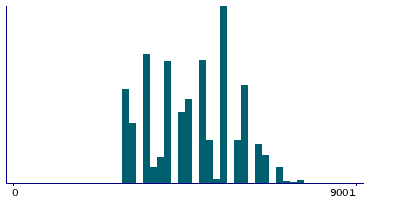
Instance 2 : Imaging visit (2014+)
42,988 participants, 352,749 items
| Maximum | 76472 |
| Decile 9 | 6006 |
| Decile 8 | 5507 |
| Decile 7 | 5506 |
| Decile 6 | 5008 |
| Median | 4509 |
| Decile 4 | 4508 |
| Decile 3 | 4009 |
| Decile 2 | 3510 |
| Decile 1 | 3011 |
| Minimum | 1139 |
|
|
- There are 75 distinct values.
- Mean = 4694.66
- Std.dev = 1113.92
- 17 items above graph maximum of 9001
|
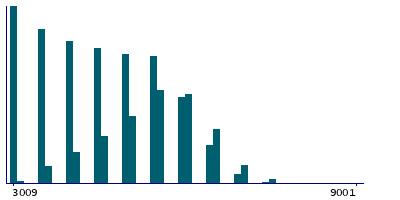
Instance 3 : First repeat imaging visit (2019+)
4,998 participants, 41,785 items
| Maximum | 9328 |
| Decile 9 | 6006 |
| Decile 8 | 6006 |
| Decile 7 | 5507 |
| Decile 6 | 5008 |
| Median | 5007 |
| Decile 4 | 4508 |
| Decile 3 | 4009 |
| Decile 2 | 3510 |
| Decile 1 | 3011 |
| Minimum | 3009 |
|
|
- There are 42 distinct values.
- Mean = 4735.77
- Std.dev = 1123.42
- 1 item above graph maximum of 9001
|
Notes
The time the number to be memorised was visible to the participant.
0 Related Data-Fields
There are no related data-fields


