Data
4,102,705 items of data are available, covering 229,110 participants.
Some values have special meanings defined by Data-Coding
17.
Defined-instances run from 0 to 3, labelled using Instancing
2.
Array indices run from 1 to 15.
Units of measurement are deciseconds.
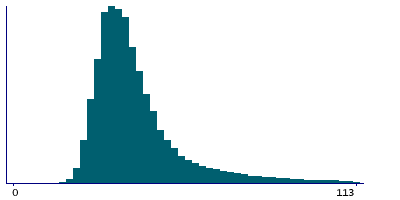
| Maximum | 100098 |
| Decile 9 | 70 |
| Decile 8 | 51 |
| Decile 7 | 44 |
| Decile 6 | 40 |
| Median | 37 |
| Decile 4 | 35 |
| Decile 3 | 32 |
| Decile 2 | 30 |
| Decile 1 | 27 |
| Minimum | 0 |
|
|
- There are 2615 distinct values.
- Mean = 53.8535
- Std.dev = 108.773
- 192026 items above graph maximum of 113
- 3634 items have value -1 (Next button not pressed)
|
4 Instances
Instance 0 : Initial assessment visit (2006-2010) at which participants were recruited and consent given
166,006 participants, 2,458,704 items
| Maximum | 14863 |
| Decile 9 | 71 |
| Decile 8 | 51 |
| Decile 7 | 45 |
| Decile 6 | 41 |
| Median | 38 |
| Decile 4 | 35 |
| Decile 3 | 33 |
| Decile 2 | 31 |
| Decile 1 | 28 |
| Minimum | 13 |
|

|
- There are 2495 distinct values.
- Mean = 56.2414
- Std.dev = 103.785
- 122402 items above graph maximum of 114
- 2796 items have value -1 (Next button not pressed)
|
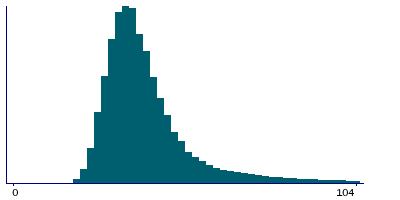
Instance 1 : First repeat assessment visit (2012-13)
19,956 participants, 298,004 items
| Maximum | 5832 |
| Decile 9 | 66 |
| Decile 8 | 49 |
| Decile 7 | 44 |
| Decile 6 | 40 |
| Median | 37 |
| Decile 4 | 35 |
| Decile 3 | 33 |
| Decile 2 | 31 |
| Decile 1 | 28 |
| Minimum | 14 |
|
|
- There are 1281 distinct values.
- Mean = 51.9484
- Std.dev = 82.9202
- 13626 items above graph maximum of 104
- 123 items have value -1 (Next button not pressed)
|
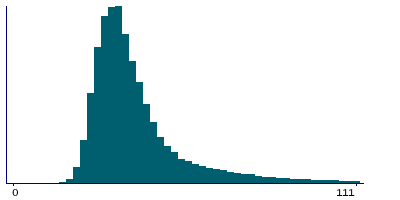
Instance 2 : Imaging visit (2014+)
81,558 participants, 1,216,332 items
| Maximum | 100098 |
| Decile 9 | 69 |
| Decile 8 | 50 |
| Decile 7 | 43 |
| Decile 6 | 39 |
| Median | 36 |
| Decile 4 | 34 |
| Decile 3 | 31 |
| Decile 2 | 29 |
| Decile 1 | 27 |
| Minimum | 0 |
|
|
- There are 1687 distinct values.
- Mean = 50.3131
- Std.dev = 126.485
- 53063 items above graph maximum of 111
- 667 items have value -1 (Next button not pressed)
|
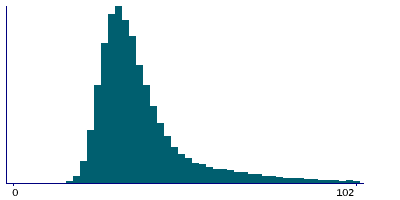
Instance 3 : First repeat imaging visit (2019+)
8,677 participants, 129,665 items
| Maximum | 5074 |
| Decile 9 | 64 |
| Decile 8 | 47 |
| Decile 7 | 41 |
| Decile 6 | 37 |
| Median | 35 |
| Decile 4 | 33 |
| Decile 3 | 31 |
| Decile 2 | 28 |
| Decile 1 | 26 |
| Minimum | 14 |
|
|
- There are 773 distinct values.
- Mean = 46.1936
- Std.dev = 62.7348
- 5088 items above graph maximum of 102
- 48 items have value -1 (Next button not pressed)
|
Notes
This is the time taken to press the 'next' key on the touchscreen in each round since the triplet played (left ear). This should not be used as a marker of reaction time as participants were not explicity instructed to complete the test as quickly we possible.
Coding 17 defines 1 special value:
- -1 represents "Next button not pressed"