Data
506,643 items of data are available, covering 487,279 participants.
Defined-instances run from 0 to 1, labelled using Instancing
2.
Units of measurement are mmol/l.
| Maximum | 43.5025 |
| Decile 9 | 6.20252 |
| Decile 8 | 5.71839 |
| Decile 7 | 5.4554 |
| Decile 6 | 5.25994 |
| Median | 5.09188 |
| Decile 4 | 4.93314 |
| Decile 3 | 4.77021 |
| Decile 2 | 4.58258 |
| Decile 1 | 4.32217 |
| Minimum | 1.72873 |
|

|
- Mean = 5.27389
- Std.dev = 1.20601
- 43 items below graph minimum of 2.44182
- 11248 items above graph maximum of 8.08287
|
2 Instances
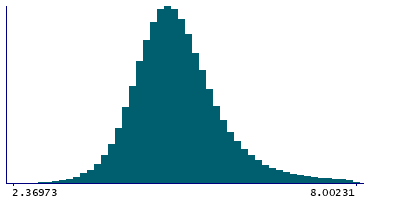
Instance 0 : Initial assessment visit (2006-2010) at which participants were recruited and consent given
486,812 participants, 486,812 items
| Maximum | 43.5025 |
| Decile 9 | 6.18144 |
| Decile 8 | 5.69688 |
| Decile 7 | 5.43742 |
| Decile 6 | 5.24401 |
| Median | 5.07717 |
| Decile 4 | 4.91937 |
| Decile 3 | 4.75856 |
| Decile 2 | 4.57239 |
| Decile 1 | 4.3129 |
| Minimum | 1.72873 |
|
|
- Mean = 5.26009
- Std.dev = 1.20851
- 45 items below graph minimum of 2.44436
- 11014 items above graph maximum of 8.04999
|
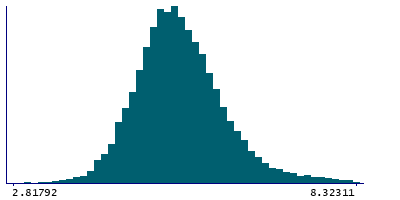
Instance 1 : First repeat assessment visit (2012-13)
19,831 participants, 19,831 items
| Maximum | 30.1634 |
| Decile 9 | 6.51765 |
| Decile 8 | 6.09305 |
| Decile 7 | 5.83715 |
| Decile 6 | 5.64142 |
| Median | 5.47046 |
| Decile 4 | 5.30836 |
| Decile 3 | 5.14107 |
| Decile 2 | 4.94958 |
| Decile 1 | 4.66986 |
| Minimum | 2.47544 |
|
|
- Mean = 5.61275
- Std.dev = 1.08923
- 3 items below graph minimum of 2.82207
- 364 items above graph maximum of 8.36543
|


