Data
507,761 items of data are available, covering 488,326 participants.
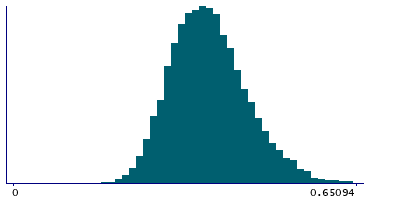
Defined-instances run from 0 to 1, labelled using Instancing
2.
Units of measurement are mmol/l.
| Maximum | 1.90314 |
| Decile 9 | 0.481304 |
| Decile 8 | 0.440681 |
| Decile 7 | 0.413442 |
| Decile 6 | 0.391281 |
| Median | 0.371356 |
| Decile 4 | 0.352249 |
| Decile 3 | 0.332775 |
| Decile 2 | 0.311219 |
| Decile 1 | 0.283839 |
| Minimum | 0.0920063 |
|

|
- Mean = 0.37853
- Std.dev = 0.0793848
- 1177 items above graph maximum of 0.678768
|
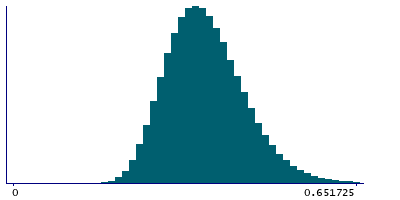
2 Instances
Instance 0 : Initial assessment visit (2006-2010) at which participants were recruited and consent given
487,886 participants, 487,886 items
| Maximum | 1.90314 |
| Decile 9 | 0.481642 |
| Decile 8 | 0.440975 |
| Decile 7 | 0.413677 |
| Decile 6 | 0.391454 |
| Median | 0.371441 |
| Decile 4 | 0.352291 |
| Decile 3 | 0.332781 |
| Decile 2 | 0.311183 |
| Decile 1 | 0.283737 |
| Minimum | 0.0920063 |
|
|
- Mean = 0.378655
- Std.dev = 0.0795671
- 1126 items above graph maximum of 0.679548
|
Instance 1 : First repeat assessment visit (2012-13)
19,875 participants, 19,875 items
| Maximum | 0.822273 |
| Decile 9 | 0.472881 |
| Decile 8 | 0.434017 |
| Decile 7 | 0.408246 |
| Decile 6 | 0.38758 |
| Median | 0.36945 |
| Decile 4 | 0.351461 |
| Decile 3 | 0.332652 |
| Decile 2 | 0.31221 |
| Decile 1 | 0.286509 |
| Minimum | 0.148529 |
|
|
- Mean = 0.375485
- Std.dev = 0.0747063
- 52 items above graph maximum of 0.659253
|


