Data
507,961 items of data are available, covering 488,513 participants.
Defined-instances run from 0 to 1, labelled using Instancing
2.
Units of measurement are mmol/l.
| Maximum | 13.2973 |
| Decile 9 | 5.9199 |
| Decile 8 | 5.47 |
| Decile 7 | 5.15842 |
| Decile 6 | 4.90156 |
| Median | 4.6651 |
| Decile 4 | 4.4304 |
| Decile 3 | 4.18232 |
| Decile 2 | 3.8966 |
| Decile 1 | 3.50251 |
| Minimum | 0.074079 |
|
|
- Mean = 4.69672
- Std.dev = 0.957484
- 530 items above graph maximum of 8.33729
|
2 Instances
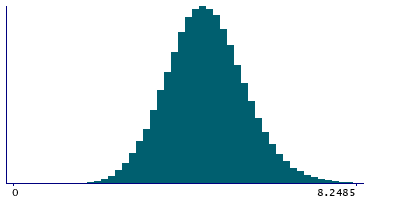
Instance 0 : Initial assessment visit (2006-2010) at which participants were recruited and consent given
488,084 participants, 488,084 items
| Maximum | 13.2973 |
| Decile 9 | 5.9187 |
| Decile 8 | 5.4694 |
| Decile 7 | 5.1577 |
| Decile 6 | 4.90132 |
| Median | 4.6652 |
| Decile 4 | 4.4311 |
| Decile 3 | 4.18361 |
| Decile 2 | 3.8988 |
| Decile 1 | 3.50639 |
| Minimum | 0.074079 |
|

|
- Mean = 4.69729
- Std.dev = 0.955761
- 500 items above graph maximum of 8.33101
|
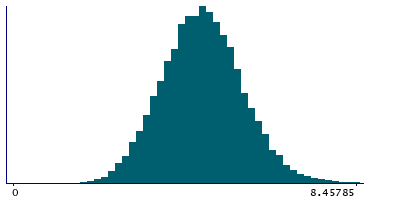
Instance 1 : First repeat assessment visit (2012-13)
19,877 participants, 19,877 items
| Maximum | 11.0337 |
| Decile 9 | 5.9476 |
| Decile 8 | 5.48314 |
| Decile 7 | 5.17883 |
| Decile 6 | 4.90955 |
| Median | 4.6624 |
| Decile 4 | 4.40988 |
| Decile 3 | 4.15255 |
| Decile 2 | 3.83855 |
| Decile 1 | 3.41475 |
| Minimum | 1.1426 |
|
|
- Mean = 4.68275
- Std.dev = 0.998763
- 25 items above graph maximum of 8.48045
|


