Data
507,961 items of data are available, covering 488,513 participants.
Defined-instances run from 0 to 1, labelled using Instancing
2.
Units of measurement are mmol/l.
| Maximum | 11.4051 |
| Decile 9 | 4.47022 |
| Decile 8 | 4.04587 |
| Decile 7 | 3.7577 |
| Decile 6 | 3.51898 |
| Median | 3.30198 |
| Decile 4 | 3.0911 |
| Decile 3 | 2.8715 |
| Decile 2 | 2.626 |
| Decile 1 | 2.30156 |
| Minimum | -0.073459 |
|

|
- Mean = 3.35478
- Std.dev = 0.85611
- 1 item below graph minimum of 0
- 565 items above graph maximum of 6.63887
|
2 Instances
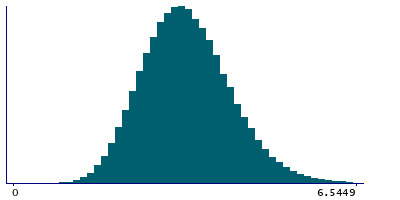
Instance 0 : Initial assessment visit (2006-2010) at which participants were recruited and consent given
488,084 participants, 488,084 items
| Maximum | 11.4051 |
| Decile 9 | 4.4726 |
| Decile 8 | 4.048 |
| Decile 7 | 3.7595 |
| Decile 6 | 3.52106 |
| Median | 3.30417 |
| Decile 4 | 3.0934 |
| Decile 3 | 2.8738 |
| Decile 2 | 2.62869 |
| Decile 1 | 2.3049 |
| Minimum | -0.073459 |
|
|
- Mean = 3.35715
- Std.dev = 0.855842
- 1 item below graph minimum of 0
- 540 items above graph maximum of 6.6403
|
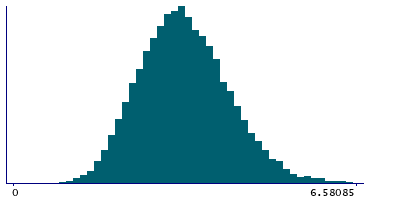
Instance 1 : First repeat assessment visit (2012-13)
19,877 participants, 19,877 items
| Maximum | 7.96253 |
| Decile 9 | 4.41125 |
| Decile 8 | 3.99615 |
| Decile 7 | 3.71375 |
| Decile 6 | 3.46405 |
| Median | 3.24524 |
| Decile 4 | 3.03765 |
| Decile 3 | 2.81735 |
| Decile 2 | 2.55315 |
| Decile 1 | 2.22441 |
| Minimum | 0.68749 |
|
|
- Mean = 3.29646
- Std.dev = 0.860629
- 25 items above graph maximum of 6.59809
|


