Data
507,961 items of data are available, covering 488,513 participants.
Defined-instances run from 0 to 1, labelled using Instancing
2.
Units of measurement are mmol/l.
| Maximum | 10.0736 |
| Decile 9 | 3.551 |
| Decile 8 | 3.1916 |
| Decile 7 | 2.9469 |
| Decile 6 | 2.74292 |
| Median | 2.5561 |
| Decile 4 | 2.3736 |
| Decile 3 | 2.1824 |
| Decile 2 | 1.9656 |
| Decile 1 | 1.6763 |
| Minimum | 0 |
|
|
- Mean = 2.59308
- Std.dev = 0.741219
- 501 items above graph maximum of 5.4257
|
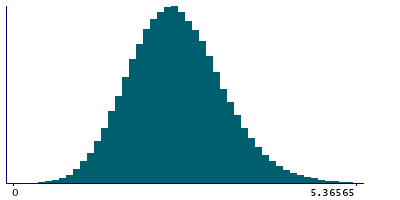
2 Instances
Instance 0 : Initial assessment visit (2006-2010) at which participants were recruited and consent given
488,084 participants, 488,084 items
| Maximum | 10.0736 |
| Decile 9 | 3.5529 |
| Decile 8 | 3.19344 |
| Decile 7 | 2.94836 |
| Decile 6 | 2.7447 |
| Median | 2.5581 |
| Decile 4 | 2.3756 |
| Decile 3 | 2.18457 |
| Decile 2 | 1.96847 |
| Decile 1 | 1.6793 |
| Minimum | 0 |
|

|
- Mean = 2.59514
- Std.dev = 0.740814
- 473 items above graph maximum of 5.4265
|
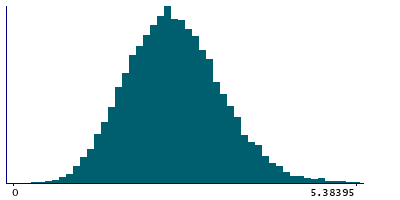
Instance 1 : First repeat assessment visit (2012-13)
19,877 participants, 19,877 items
| Maximum | 6.73283 |
| Decile 9 | 3.5075 |
| Decile 8 | 3.14847 |
| Decile 7 | 2.9053 |
| Decile 6 | 2.69575 |
| Median | 2.5027 |
| Decile 4 | 2.3259 |
| Decile 3 | 2.1264 |
| Decile 2 | 1.8985 |
| Decile 1 | 1.6116 |
| Minimum | 0.1645 |
|
|
- Mean = 2.54243
- Std.dev = 0.749323
- 27 items above graph maximum of 5.4034
|


