Data
507,960 items of data are available, covering 488,512 participants.
Defined-instances run from 0 to 1, labelled using Instancing
2.
Units of measurement are mmol/l.
| Maximum | 7.60694 |
| Decile 9 | 1.64305 |
| Decile 8 | 1.3374 |
| Decile 7 | 1.13578 |
| Decile 6 | 0.97579 |
| Median | 0.83895 |
| Decile 4 | 0.717208 |
| Decile 3 | 0.60664 |
| Decile 2 | 0.50022 |
| Decile 1 | 0.390086 |
| Minimum | 0.1139 |
|

|
- Mean = 0.946957
- Std.dev = 0.518653
- 2264 items above graph maximum of 2.89601
|
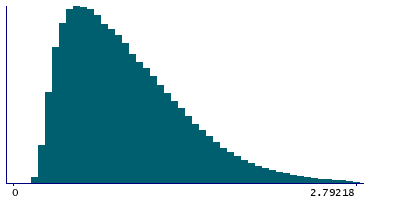
2 Instances
Instance 0 : Initial assessment visit (2006-2010) at which participants were recruited and consent given
488,083 participants, 488,083 items
| Maximum | 7.60694 |
| Decile 9 | 1.6459 |
| Decile 8 | 1.33981 |
| Decile 7 | 1.13729 |
| Decile 6 | 0.97665 |
| Median | 0.839511 |
| Decile 4 | 0.71732 |
| Decile 3 | 0.60646 |
| Decile 2 | 0.499739 |
| Decile 1 | 0.38956 |
| Minimum | 0.1139 |
|
|
- Mean = 0.947895
- Std.dev = 0.520123
- 2181 items above graph maximum of 2.90224
|
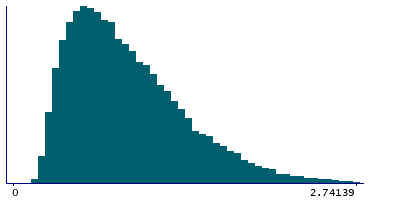
Instance 1 : First repeat assessment visit (2012-13)
19,877 participants, 19,877 items
| Maximum | 5.6036 |
| Decile 9 | 1.57015 |
| Decile 8 | 1.28205 |
| Decile 7 | 1.1004 |
| Decile 6 | 0.953595 |
| Median | 0.827 |
| Decile 4 | 0.715143 |
| Decile 3 | 0.61265 |
| Decile 2 | 0.511375 |
| Decile 1 | 0.40265 |
| Minimum | 0.14612 |
|
|
- Mean = 0.923927
- Std.dev = 0.480568
- 89 items above graph maximum of 2.73765
|


