Data
507,960 items of data are available, covering 488,512 participants.
Defined-instances run from 0 to 1, labelled using Instancing
2.
Units of measurement are mmol/l.
| Maximum | 0.920813 |
| Decile 9 | 0.210248 |
| Decile 8 | 0.18244 |
| Decile 7 | 0.16507 |
| Decile 6 | 0.15166 |
| Median | 0.14007 |
| Decile 4 | 0.129307 |
| Decile 3 | 0.118558 |
| Decile 2 | 0.10686 |
| Decile 1 | 0.092119 |
| Minimum | 0.0053277 |
|

|
- Mean = 0.147068
- Std.dev = 0.0492757
- 2524 items above graph maximum of 0.328376
|
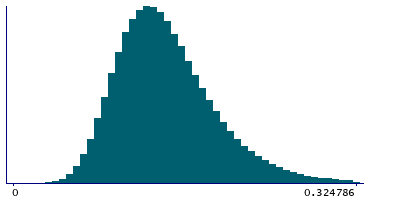
2 Instances
Instance 0 : Initial assessment visit (2006-2010) at which participants were recruited and consent given
488,083 participants, 488,083 items
| Maximum | 0.920813 |
| Decile 9 | 0.210558 |
| Decile 8 | 0.18265 |
| Decile 7 | 0.16522 |
| Decile 6 | 0.15175 |
| Median | 0.140145 |
| Decile 4 | 0.129364 |
| Decile 3 | 0.11856 |
| Decile 2 | 0.10683 |
| Decile 1 | 0.0920495 |
| Minimum | 0.0053277 |
|
|
- Mean = 0.147177
- Std.dev = 0.049442
- 2431 items above graph maximum of 0.329067
|
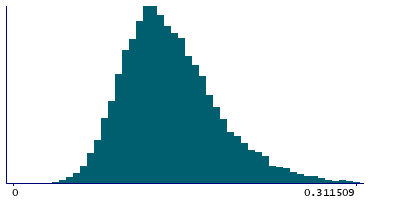
Instance 1 : First repeat assessment visit (2012-13)
19,877 participants, 19,877 items
| Maximum | 0.469372 |
| Decile 9 | 0.203365 |
| Decile 8 | 0.17738 |
| Decile 7 | 0.161854 |
| Decile 6 | 0.149406 |
| Median | 0.138275 |
| Decile 4 | 0.12821 |
| Decile 3 | 0.11846 |
| Decile 2 | 0.107433 |
| Decile 1 | 0.093661 |
| Minimum | 0.030112 |
|
|
- Mean = 0.144393
- Std.dev = 0.0449156
- 79 items above graph maximum of 0.313069
|


