Data
507,960 items of data are available, covering 488,512 participants.
Defined-instances run from 0 to 1, labelled using Instancing
2.
Units of measurement are mmol/l.
| Maximum | 4.57193 |
| Decile 9 | 2.013 |
| Decile 8 | 1.8386 |
| Decile 7 | 1.7208 |
| Decile 6 | 1.62708 |
| Median | 1.54374 |
| Decile 4 | 1.4647 |
| Decile 3 | 1.38569 |
| Decile 2 | 1.2997 |
| Decile 1 | 1.1915 |
| Minimum | 0.22733 |
|
|
- Mean = 1.5792
- Std.dev = 0.327618
- 891 items above graph maximum of 2.8345
|
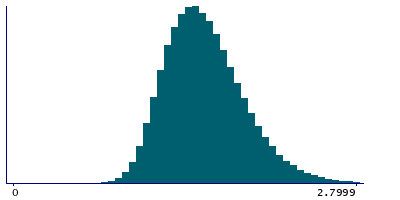
2 Instances
Instance 0 : Initial assessment visit (2006-2010) at which participants were recruited and consent given
488,083 participants, 488,083 items
| Maximum | 4.57193 |
| Decile 9 | 2.01115 |
| Decile 8 | 1.8366 |
| Decile 7 | 1.7189 |
| Decile 6 | 1.62527 |
| Median | 1.5422 |
| Decile 4 | 1.4634 |
| Decile 3 | 1.38433 |
| Decile 2 | 1.29843 |
| Decile 1 | 1.1903 |
| Minimum | 0.22733 |
|

|
- Mean = 1.57763
- Std.dev = 0.327315
- 853 items above graph maximum of 2.832
|
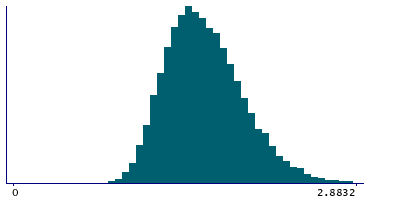
Instance 1 : First repeat assessment visit (2012-13)
19,877 participants, 19,877 items
| Maximum | 4.023 |
| Decile 9 | 2.0578 |
| Decile 8 | 1.8837 |
| Decile 7 | 1.76612 |
| Decile 6 | 1.67185 |
| Median | 1.58284 |
| Decile 4 | 1.50065 |
| Decile 3 | 1.41965 |
| Decile 2 | 1.3319 |
| Decile 1 | 1.2202 |
| Minimum | 0.73751 |
|
|
- Mean = 1.61754
- Std.dev = 0.332684
- 35 items above graph maximum of 2.8954
|


