Data
507,960 items of data are available, covering 488,512 participants.
Defined-instances run from 0 to 1, labelled using Instancing
2.
Units of measurement are mmol/l.
| Maximum | 1.74862 |
| Decile 9 | 0.625611 |
| Decile 8 | 0.55117 |
| Decile 7 | 0.500459 |
| Decile 6 | 0.45876 |
| Median | 0.42104 |
| Decile 4 | 0.38489 |
| Decile 3 | 0.348059 |
| Decile 2 | 0.30786 |
| Decile 1 | 0.25796 |
| Minimum | 0.040817 |
|
|
- Mean = 0.433817
- Std.dev = 0.144974
- 645 items above graph maximum of 0.993263
|
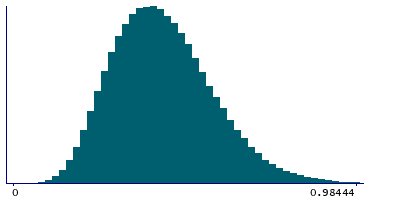
2 Instances
Instance 0 : Initial assessment visit (2006-2010) at which participants were recruited and consent given
488,083 participants, 488,083 items
| Maximum | 1.74862 |
| Decile 9 | 0.62611 |
| Decile 8 | 0.55161 |
| Decile 7 | 0.5009 |
| Decile 6 | 0.459188 |
| Median | 0.421442 |
| Decile 4 | 0.385256 |
| Decile 3 | 0.34845 |
| Decile 2 | 0.3082 |
| Decile 1 | 0.258295 |
| Minimum | 0.040817 |
|

|
- Mean = 0.434234
- Std.dev = 0.145082
- 627 items above graph maximum of 0.993925
|
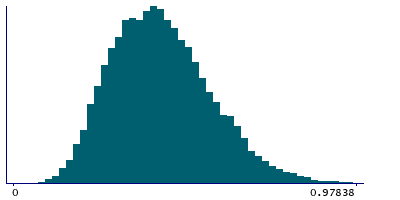
Instance 1 : First repeat assessment visit (2012-13)
19,877 participants, 19,877 items
| Maximum | 1.34189 |
| Decile 9 | 0.61472 |
| Decile 8 | 0.539355 |
| Decile 7 | 0.489765 |
| Decile 6 | 0.448512 |
| Median | 0.41203 |
| Decile 4 | 0.37599 |
| Decile 3 | 0.33823 |
| Decile 2 | 0.299781 |
| Decile 1 | 0.25087 |
| Minimum | 0.0733685 |
|
|
- Mean = 0.423576
- Std.dev = 0.14189
- 18 items above graph maximum of 0.97857
|


