Data
507,960 items of data are available, covering 488,512 participants.
Defined-instances run from 0 to 1, labelled using Instancing
2.
Units of measurement are mmol/l.
| Maximum | 3.44636 |
| Decile 9 | 1.4025 |
| Decile 8 | 1.25689 |
| Decile 7 | 1.15803 |
| Decile 6 | 1.07763 |
| Median | 1.0078 |
| Decile 4 | 0.943 |
| Decile 3 | 0.87999 |
| Decile 2 | 0.81441 |
| Decile 1 | 0.73576 |
| Minimum | 0.0350264 |
|
|
- Mean = 1.04365
- Std.dev = 0.264616
- 754 items above graph maximum of 2.06924
|
2 Instances
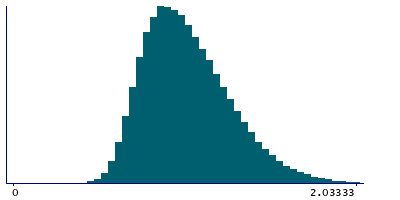
Instance 0 : Initial assessment visit (2006-2010) at which participants were recruited and consent given
488,083 participants, 488,083 items
| Maximum | 3.44636 |
| Decile 9 | 1.4009 |
| Decile 8 | 1.25505 |
| Decile 7 | 1.1562 |
| Decile 6 | 1.076 |
| Median | 1.0064 |
| Decile 4 | 0.94171 |
| Decile 3 | 0.878845 |
| Decile 2 | 0.813362 |
| Decile 1 | 0.73487 |
| Minimum | 0.0350264 |
|

|
- Mean = 1.04222
- Std.dev = 0.264237
- 721 items above graph maximum of 2.06693
|
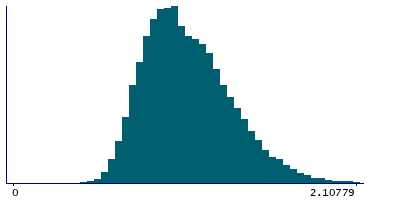
Instance 1 : First repeat assessment visit (2012-13)
19,877 participants, 19,877 items
| Maximum | 3.1358 |
| Decile 9 | 1.44324 |
| Decile 8 | 1.2997 |
| Decile 7 | 1.2004 |
| Decile 6 | 1.11895 |
| Median | 1.0439 |
| Decile 4 | 0.976323 |
| Decile 3 | 0.91095 |
| Decile 2 | 0.84281 |
| Decile 1 | 0.759795 |
| Minimum | 0.35208 |
|
|
- Mean = 1.07875
- Std.dev = 0.271408
- 30 items above graph maximum of 2.12668
|


