Data
507,328 items of data are available, covering 487,914 participants.
Defined-instances run from 0 to 1, labelled using Instancing
2.
Units of measurement are ratio.
| Maximum | 3.165 |
| Decile 9 | 0.902167 |
| Decile 8 | 0.775146 |
| Decile 7 | 0.683901 |
| Decile 6 | 0.60736 |
| Median | 0.54049 |
| Decile 4 | 0.47916 |
| Decile 3 | 0.42169 |
| Decile 2 | 0.365758 |
| Decile 1 | 0.306411 |
| Minimum | 0.10882 |
|
|
- Mean = 0.577952
- Std.dev = 0.23367
- 543 items above graph maximum of 1.49792
|
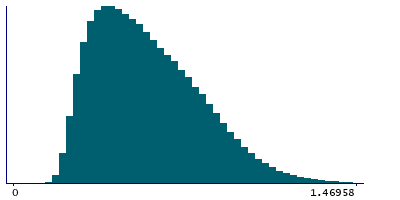
2 Instances
Instance 0 : Initial assessment visit (2006-2010) at which participants were recruited and consent given
487,463 participants, 487,463 items
| Maximum | 3.165 |
| Decile 9 | 0.90367 |
| Decile 8 | 0.77612 |
| Decile 7 | 0.684909 |
| Decile 6 | 0.608065 |
| Median | 0.54099 |
| Decile 4 | 0.47947 |
| Decile 3 | 0.42182 |
| Decile 2 | 0.365722 |
| Decile 1 | 0.306241 |
| Minimum | 0.10882 |
|

|
- Mean = 0.578512
- Std.dev = 0.234226
- 511 items above graph maximum of 1.5011
|
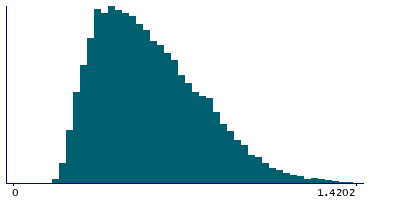
Instance 1 : First repeat assessment visit (2012-13)
19,865 participants, 19,865 items
| Maximum | 1.7704 |
| Decile 9 | 0.865375 |
| Decile 8 | 0.74918 |
| Decile 7 | 0.661213 |
| Decile 6 | 0.591686 |
| Median | 0.529355 |
| Decile 4 | 0.473 |
| Decile 3 | 0.4194 |
| Decile 2 | 0.36671 |
| Decile 1 | 0.310365 |
| Minimum | 0.15422 |
|
|
- Mean = 0.564214
- Std.dev = 0.219142
- 26 items above graph maximum of 1.42039
|


