Data
507,961 items of data are available, covering 488,513 participants.
Defined-instances run from 0 to 1, labelled using Instancing
2.
Units of measurement are g/l.
| Maximum | 3.87678 |
| Decile 9 | 1.80742 |
| Decile 8 | 1.67646 |
| Decile 7 | 1.58848 |
| Decile 6 | 1.51757 |
| Median | 1.45438 |
| Decile 4 | 1.394 |
| Decile 3 | 1.33327 |
| Decile 2 | 1.2663 |
| Decile 1 | 1.1799 |
| Minimum | 0.297728 |
|

|
- Mean = 1.47822
- Std.dev = 0.250743
- 890 items above graph maximum of 2.43493
|
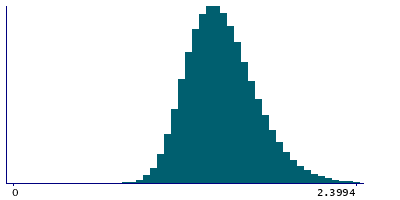
2 Instances
Instance 0 : Initial assessment visit (2006-2010) at which participants were recruited and consent given
488,084 participants, 488,084 items
| Maximum | 3.87678 |
| Decile 9 | 1.80627 |
| Decile 8 | 1.6752 |
| Decile 7 | 1.58723 |
| Decile 6 | 1.51642 |
| Median | 1.4534 |
| Decile 4 | 1.39301 |
| Decile 3 | 1.3324 |
| Decile 2 | 1.2655 |
| Decile 1 | 1.17926 |
| Minimum | 0.297728 |
|
|
- Mean = 1.47722
- Std.dev = 0.250526
- 849 items above graph maximum of 2.43328
|
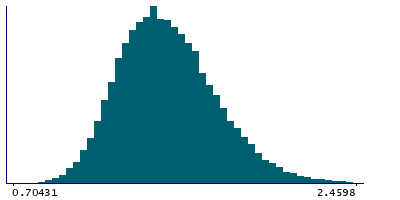
Instance 1 : First repeat assessment visit (2012-13)
19,877 participants, 19,877 items
| Maximum | 3.4713 |
| Decile 9 | 1.83714 |
| Decile 8 | 1.7057 |
| Decile 7 | 1.6181 |
| Decile 6 | 1.546 |
| Median | 1.4805 |
| Decile 4 | 1.41807 |
| Decile 3 | 1.35463 |
| Decile 2 | 1.2863 |
| Decile 1 | 1.1992 |
| Minimum | 0.70431 |
|
|
- Mean = 1.5028
- Std.dev = 0.25477
- 42 items above graph maximum of 2.47508
|


