Data
507,327 items of data are available, covering 487,913 participants.
Defined-instances run from 0 to 1, labelled using Instancing
2.
Units of measurement are mmol/l.
| Maximum | 6.6655 |
| Decile 9 | 0.826319 |
| Decile 8 | 0.69872 |
| Decile 7 | 0.61971 |
| Decile 6 | 0.55826 |
| Median | 0.50545 |
| Decile 4 | 0.45693 |
| Decile 3 | 0.40858 |
| Decile 2 | 0.35692 |
| Decile 1 | 0.292119 |
| Minimum | 0.000549697 |
|

|
- Mean = 0.539791
- Std.dev = 0.225353
- 2873 items above graph maximum of 1.36052
|
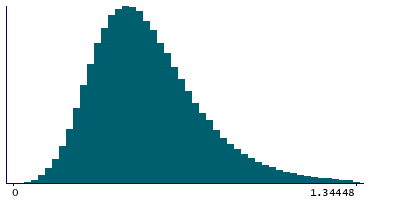
2 Instances
Instance 0 : Initial assessment visit (2006-2010) at which participants were recruited and consent given
487,462 participants, 487,462 items
| Maximum | 6.6655 |
| Decile 9 | 0.826051 |
| Decile 8 | 0.698306 |
| Decile 7 | 0.61924 |
| Decile 6 | 0.5578 |
| Median | 0.50502 |
| Decile 4 | 0.456531 |
| Decile 3 | 0.408198 |
| Decile 2 | 0.356593 |
| Decile 1 | 0.29186 |
| Minimum | 0.000549697 |
|
|
- Mean = 0.539458
- Std.dev = 0.225448
- 2771 items above graph maximum of 1.36024
|
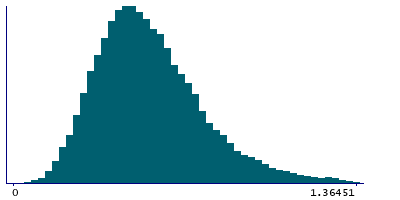
Instance 1 : First repeat assessment visit (2012-13)
19,865 participants, 19,865 items
| Maximum | 2.39621 |
| Decile 9 | 0.833115 |
| Decile 8 | 0.70752 |
| Decile 7 | 0.63069 |
| Decile 6 | 0.56911 |
| Median | 0.5162 |
| Decile 4 | 0.46696 |
| Decile 3 | 0.418565 |
| Decile 2 | 0.364789 |
| Decile 1 | 0.299025 |
| Minimum | 0.025161 |
|
|
- Mean = 0.547971
- Std.dev = 0.222851
- 103 items above graph maximum of 1.36721
|


