Data
507,327 items of data are available, covering 487,913 participants.
Defined-instances run from 0 to 1, labelled using Instancing
2.
Units of measurement are mmol/l.
| Maximum | 14.5686 |
| Decile 9 | 4.0921 |
| Decile 8 | 3.5754 |
| Decile 7 | 3.254 |
| Decile 6 | 3.01133 |
| Median | 2.8074 |
| Decile 4 | 2.6234 |
| Decile 3 | 2.4439 |
| Decile 2 | 2.25526 |
| Decile 1 | 2.0192 |
| Minimum | 5.5166e-06 |
|
|
- Mean = 2.95985
- Std.dev = 0.870742
- 2708 items above graph maximum of 6.165
|
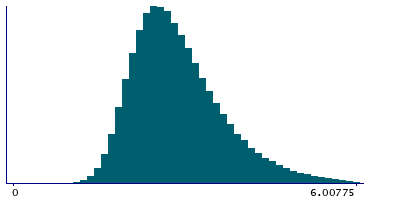
2 Instances
Instance 0 : Initial assessment visit (2006-2010) at which participants were recruited and consent given
487,462 participants, 487,462 items
| Maximum | 14.5686 |
| Decile 9 | 4.09736 |
| Decile 8 | 3.5777 |
| Decile 7 | 3.2547 |
| Decile 6 | 3.0112 |
| Median | 2.80635 |
| Decile 4 | 2.622 |
| Decile 3 | 2.44207 |
| Decile 2 | 2.25319 |
| Decile 1 | 2.0175 |
| Minimum | 5.5166e-06 |
|

|
- Mean = 2.96018
- Std.dev = 0.873665
- 2605 items above graph maximum of 6.17722
|
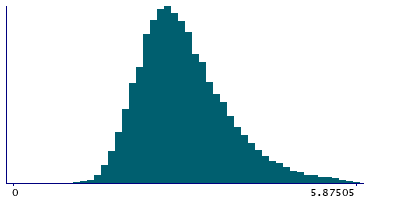
Instance 1 : First repeat assessment visit (2012-13)
19,865 participants, 19,865 items
| Maximum | 10.191 |
| Decile 9 | 3.9821 |
| Decile 8 | 3.5264 |
| Decile 7 | 3.2372 |
| Decile 6 | 3.0137 |
| Median | 2.8325 |
| Decile 4 | 2.66082 |
| Decile 3 | 2.49 |
| Decile 2 | 2.3065 |
| Decile 1 | 2.06355 |
| Minimum | 1.0195 |
|
|
- Mean = 2.95172
- Std.dev = 0.795606
- 86 items above graph maximum of 5.90065
|


