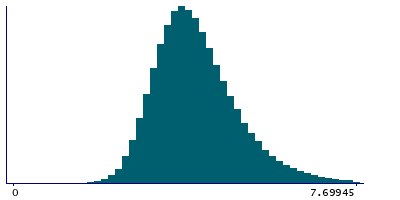
Data
507,327 items of data are available, covering 487,913 participants.
Defined-instances run from 0 to 1, labelled using Instancing
2.
Units of measurement are mmol/l.
| Maximum | 17.514 |
| Decile 9 | 5.4661 |
| Decile 8 | 4.9029 |
| Decile 7 | 4.55076 |
| Decile 6 | 4.2809 |
| Median | 4.0497 |
| Decile 4 | 3.8348 |
| Decile 3 | 3.6203 |
| Decile 2 | 3.38342 |
| Decile 1 | 3.0792 |
| Minimum | 1.8095e-05 |
|
|
- Mean = 4.19052
- Std.dev = 0.999164
- 2492 items above graph maximum of 7.853
|
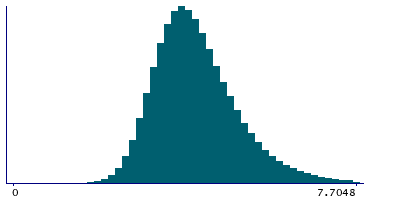
2 Instances
Instance 0 : Initial assessment visit (2006-2010) at which participants were recruited and consent given
487,462 participants, 487,462 items
| Maximum | 17.514 |
| Decile 9 | 5.4702 |
| Decile 8 | 4.90465 |
| Decile 7 | 4.5508 |
| Decile 6 | 4.2799 |
| Median | 4.04818 |
| Decile 4 | 3.8331 |
| Decile 3 | 3.6183 |
| Decile 2 | 3.3818 |
| Decile 1 | 3.07777 |
| Minimum | 1.8095e-05 |
|
|
- Mean = 4.19058
- Std.dev = 1.00174
- 2399 items above graph maximum of 7.86263
|
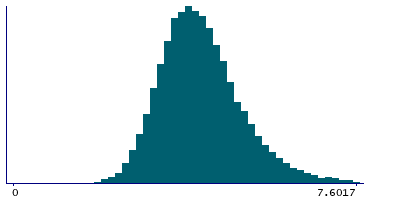
Instance 1 : First repeat assessment visit (2012-13)
19,865 participants, 19,865 items
| Maximum | 11.859 |
| Decile 9 | 5.37045 |
| Decile 8 | 4.864 |
| Decile 7 | 4.54925 |
| Decile 6 | 4.3052 |
| Median | 4.0884 |
| Decile 4 | 3.8757 |
| Decile 3 | 3.66327 |
| Decile 2 | 3.4277 |
| Decile 1 | 3.12315 |
| Minimum | 1.6019 |
|
|
- Mean = 4.18891
- Std.dev = 0.933603
- 81 items above graph maximum of 7.61775
|


