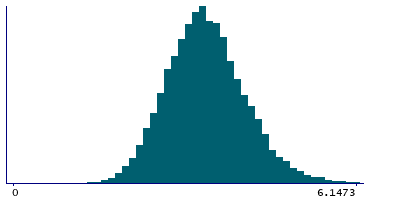
Data
507,327 items of data are available, covering 487,913 participants.
Defined-instances run from 0 to 1, labelled using Instancing
2.
Units of measurement are mmol/l.
| Maximum | 16.411 |
| Decile 9 | 4.4113 |
| Decile 8 | 4.06161 |
| Decile 7 | 3.8254 |
| Decile 6 | 3.6356 |
| Median | 3.46376 |
| Decile 4 | 3.2979 |
| Decile 3 | 3.1243 |
| Decile 2 | 2.9263 |
| Decile 1 | 2.66048 |
| Minimum | 0.0048941 |
|
|
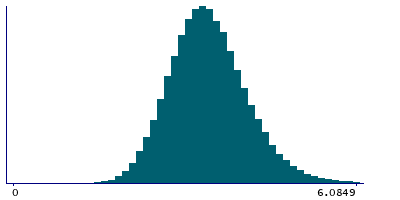
- Mean = 3.51081
- Std.dev = 0.703932
- 987 items above graph maximum of 6.16212
|
2 Instances
Instance 0 : Initial assessment visit (2006-2010) at which participants were recruited and consent given
487,462 participants, 487,462 items
| Maximum | 16.411 |
| Decile 9 | 4.41271 |
| Decile 8 | 4.0628 |
| Decile 7 | 3.82656 |
| Decile 6 | 3.6367 |
| Median | 3.46536 |
| Decile 4 | 3.2993 |
| Decile 3 | 3.1259 |
| Decile 2 | 2.92827 |
| Decile 1 | 2.6628 |
| Minimum | 0.0048941 |
|
|
- Mean = 3.51252
- Std.dev = 0.703472
- 945 items above graph maximum of 6.16262
|
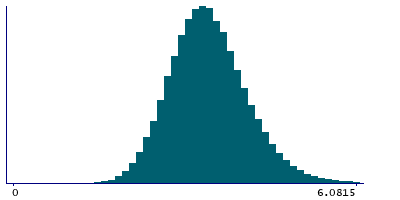
Instance 1 : First repeat assessment visit (2012-13)
19,865 participants, 19,865 items
| Maximum | 7.91451 |
| Decile 9 | 4.3772 |
| Decile 8 | 4.0302 |
| Decile 7 | 3.79405 |
| Decile 6 | 3.6066 |
| Median | 3.42682 |
| Decile 4 | 3.2631 |
| Decile 3 | 3.08105 |
| Decile 2 | 2.87338 |
| Decile 1 | 2.59325 |
| Minimum | 0.87964 |
|
|
- Mean = 3.46883
- Std.dev = 0.713845
- 40 items above graph maximum of 6.16115
|


