Data
507,327 items of data are available, covering 487,913 participants.
Defined-instances run from 0 to 1, labelled using Instancing
2.
Units of measurement are percent.
| Maximum | 100 |
| Decile 9 | 46.457 |
| Decile 8 | 45.2586 |
| Decile 7 | 44.355 |
| Decile 6 | 43.514 |
| Median | 42.668 |
| Decile 4 | 41.7277 |
| Decile 3 | 40.611 |
| Decile 2 | 39.159 |
| Decile 1 | 36.9558 |
| Minimum | 19.429 |
|
|
- Mean = 42.1333
- Std.dev = 3.79818
- 563 items below graph minimum of 27.4546
- 13 items above graph maximum of 55.9582
|
2 Instances
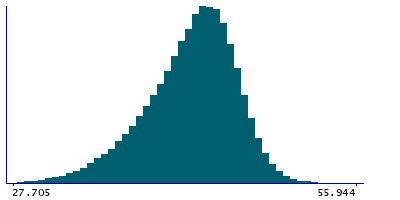
Instance 0 : Initial assessment visit (2006-2010) at which participants were recruited and consent given
487,462 participants, 487,462 items
| Maximum | 100 |
| Decile 9 | 46.473 |
| Decile 8 | 45.271 |
| Decile 7 | 44.367 |
| Decile 6 | 43.5256 |
| Median | 42.674 |
| Decile 4 | 41.7301 |
| Decile 3 | 40.6097 |
| Decile 2 | 39.1532 |
| Decile 1 | 36.9437 |
| Minimum | 19.429 |
|

|
- Mean = 42.1368
- Std.dev = 3.80942
- 540 items below graph minimum of 27.4144
- 13 items above graph maximum of 56.0023
|
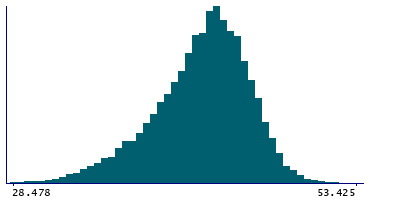
Instance 1 : First repeat assessment visit (2012-13)
19,865 participants, 19,865 items
| Maximum | 53.4309 |
| Decile 9 | 46.0785 |
| Decile 8 | 44.908 |
| Decile 7 | 44.049 |
| Decile 6 | 43.275 |
| Median | 42.531 |
| Decile 4 | 41.675 |
| Decile 3 | 40.6375 |
| Decile 2 | 39.311 |
| Decile 1 | 37.2922 |
| Minimum | 22.7654 |
|
|
- Mean = 42.0467
- Std.dev = 3.50998
- 20 items below graph minimum of 28.5059
|


