Data
507,327 items of data are available, covering 487,913 participants.
Defined-instances run from 0 to 1, labelled using Instancing
2.
Units of measurement are percent.
| Maximum | 84.595 |
| Decile 9 | 33.015 |
| Decile 8 | 31.704 |
| Decile 7 | 30.7515 |
| Decile 6 | 29.899 |
| Median | 29.074 |
| Decile 4 | 28.212 |
| Decile 3 | 27.249 |
| Decile 2 | 26.068 |
| Decile 1 | 24.3441 |
| Minimum | 0.16818 |
|
|
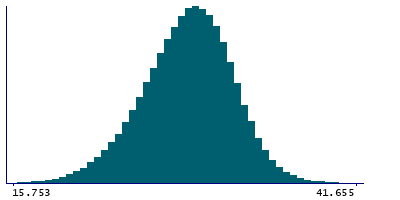
- Mean = 28.8628
- Std.dev = 3.44747
- 160 items below graph minimum of 15.6731
- 157 items above graph maximum of 41.6859
|
2 Instances
Instance 0 : Initial assessment visit (2006-2010) at which participants were recruited and consent given
487,462 participants, 487,462 items
| Maximum | 84.595 |
| Decile 9 | 33.032 |
| Decile 8 | 31.722 |
| Decile 7 | 30.769 |
| Decile 6 | 29.9181 |
| Median | 29.092 |
| Decile 4 | 28.23 |
| Decile 3 | 27.267 |
| Decile 2 | 26.083 |
| Decile 1 | 24.3555 |
| Minimum | 0.16818 |
|

|
- Mean = 28.8794
- Std.dev = 3.45048
- 155 items below graph minimum of 15.6789
- 151 items above graph maximum of 41.7085
|
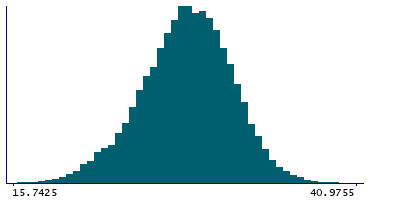
Instance 1 : First repeat assessment visit (2012-13)
19,865 participants, 19,865 items
| Maximum | 44.832 |
| Decile 9 | 32.5498 |
| Decile 8 | 31.233 |
| Decile 7 | 30.285 |
| Decile 6 | 29.432 |
| Median | 28.605 |
| Decile 4 | 27.79 |
| Decile 3 | 26.8567 |
| Decile 2 | 25.701 |
| Decile 1 | 24.123 |
| Minimum | 14.4603 |
|
|
- Mean = 28.4542
- Std.dev = 3.34697
- 6 items below graph minimum of 15.6962
- 7 items above graph maximum of 40.9765
|


