Data
505,970 items of data are available, covering 486,586 participants.
Defined-instances run from 0 to 1, labelled using Instancing
2.
Units of measurement are mmol/l.
| Maximum | 1.8818 |
| Decile 9 | 0.669753 |
| Decile 8 | 0.63097 |
| Decile 7 | 0.60416 |
| Decile 6 | 0.581552 |
| Median | 0.56072 |
| Decile 4 | 0.53988 |
| Decile 3 | 0.51771 |
| Decile 2 | 0.49134 |
| Decile 1 | 0.45348 |
| Minimum | 0.066283 |
|
|
- Mean = 0.561458
- Std.dev = 0.0867388
- 175 items below graph minimum of 0.237207
- 475 items above graph maximum of 0.886026
|
2 Instances
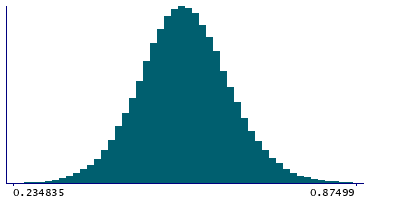
Instance 0 : Initial assessment visit (2006-2010) at which participants were recruited and consent given
486,112 participants, 486,112 items
| Maximum | 1.8818 |
| Decile 9 | 0.668355 |
| Decile 8 | 0.629616 |
| Decile 7 | 0.60287 |
| Decile 6 | 0.58039 |
| Median | 0.55949 |
| Decile 4 | 0.538721 |
| Decile 3 | 0.5166 |
| Decile 2 | 0.490202 |
| Decile 1 | 0.45238 |
| Minimum | 0.066283 |
|

|
- Mean = 0.560224
- Std.dev = 0.0866038
- 169 items below graph minimum of 0.236405
- 446 items above graph maximum of 0.884331
|
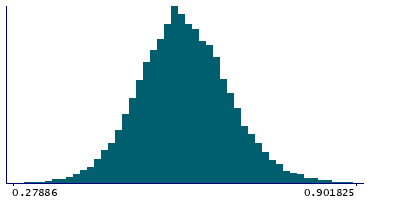
Instance 1 : First repeat assessment visit (2012-13)
19,858 participants, 19,858 items
| Maximum | 1.1941 |
| Decile 9 | 0.69734 |
| Decile 8 | 0.65848 |
| Decile 7 | 0.6326 |
| Decile 6 | 0.609675 |
| Median | 0.58856 |
| Decile 4 | 0.56899 |
| Decile 3 | 0.548285 |
| Decile 2 | 0.523332 |
| Decile 1 | 0.488475 |
| Minimum | 0.22334 |
|
|
- Mean = 0.591656
- Std.dev = 0.0845427
- 4 items below graph minimum of 0.27961
- 33 items above graph maximum of 0.906205
|


