Data
507,920 items of data are available, covering 488,474 participants.
Defined-instances run from 0 to 1, labelled using Instancing
2.
Units of measurement are mmol/l.
| Maximum | 0.449009 |
| Decile 9 | 0.142747 |
| Decile 8 | 0.12631 |
| Decile 7 | 0.116229 |
| Decile 6 | 0.10851 |
| Median | 0.10187 |
| Decile 4 | 0.095685 |
| Decile 3 | 0.089522 |
| Decile 2 | 0.082714 |
| Decile 1 | 0.073895 |
| Minimum | 0.00430688 |
|
|
- Mean = 0.106038
- Std.dev = 0.0292223
- 3034 items above graph maximum of 0.211599
|
2 Instances
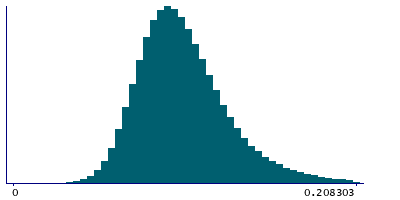
Instance 0 : Initial assessment visit (2006-2010) at which participants were recruited and consent given
488,044 participants, 488,044 items
| Maximum | 0.449009 |
| Decile 9 | 0.14304 |
| Decile 8 | 0.12661 |
| Decile 7 | 0.11653 |
| Decile 6 | 0.10879 |
| Median | 0.10214 |
| Decile 4 | 0.0959586 |
| Decile 3 | 0.0897735 |
| Decile 2 | 0.08298 |
| Decile 1 | 0.074152 |
| Minimum | 0.00430688 |
|

|
- Mean = 0.106317
- Std.dev = 0.029234
- 2906 items above graph maximum of 0.211928
|
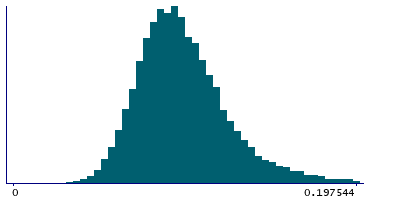
Instance 1 : First repeat assessment visit (2012-13)
19,876 participants, 19,876 items
| Maximum | 0.35707 |
| Decile 9 | 0.133685 |
| Decile 8 | 0.117625 |
| Decile 7 | 0.108566 |
| Decile 6 | 0.101285 |
| Median | 0.095066 |
| Decile 4 | 0.089386 |
| Decile 3 | 0.0835837 |
| Decile 2 | 0.0771025 |
| Decile 1 | 0.068747 |
| Minimum | 0.016539 |
|
|
- Mean = 0.0991993
- Std.dev = 0.0280815
- 153 items above graph maximum of 0.198623
|


