Data
507,565 items of data are available, covering 488,149 participants.
Defined-instances run from 0 to 1, labelled using Instancing
2.
Units of measurement are mmol/l.
| Maximum | 0.84766 |
| Decile 9 | 0.27011 |
| Decile 8 | 0.24611 |
| Decile 7 | 0.23084 |
| Decile 6 | 0.21875 |
| Median | 0.208225 |
| Decile 4 | 0.198206 |
| Decile 3 | 0.18806 |
| Decile 2 | 0.176995 |
| Decile 1 | 0.1625 |
| Minimum | 0.0644621 |
|

|
- Mean = 0.213305
- Std.dev = 0.0439795
- 1706 items above graph maximum of 0.37772
|
2 Instances
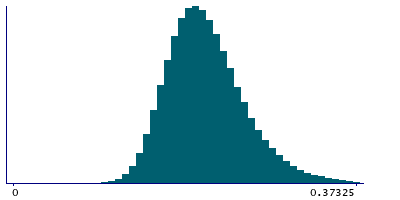
Instance 0 : Initial assessment visit (2006-2010) at which participants were recruited and consent given
487,709 participants, 487,709 items
| Maximum | 0.84766 |
| Decile 9 | 0.270298 |
| Decile 8 | 0.246294 |
| Decile 7 | 0.23101 |
| Decile 6 | 0.218882 |
| Median | 0.208341 |
| Decile 4 | 0.19829 |
| Decile 3 | 0.18813 |
| Decile 2 | 0.17704 |
| Decile 1 | 0.16251 |
| Minimum | 0.0644621 |
|
|
- Mean = 0.213409
- Std.dev = 0.0440274
- 1602 items above graph maximum of 0.378086
|
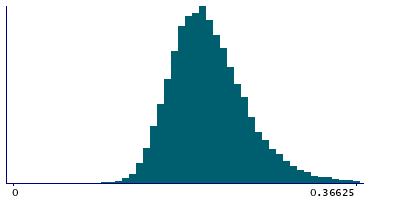
Instance 1 : First repeat assessment visit (2012-13)
19,856 participants, 19,856 items
| Maximum | 0.52766 |
| Decile 9 | 0.26502 |
| Decile 8 | 0.24178 |
| Decile 7 | 0.227003 |
| Decile 6 | 0.215398 |
| Median | 0.205317 |
| Decile 4 | 0.196204 |
| Decile 3 | 0.1863 |
| Decile 2 | 0.176014 |
| Decile 1 | 0.162355 |
| Minimum | 0.095424 |
|
|
- Mean = 0.210755
- Std.dev = 0.0427077
- 99 items above graph maximum of 0.367685
|


