Data
505,997 items of data are available, covering 486,619 participants.
Defined-instances run from 0 to 1, labelled using Instancing
2.
Units of measurement are mmol/l.
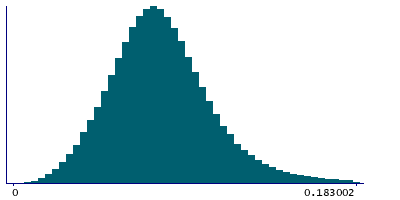
| Maximum | 1.8478 |
| Decile 9 | 0.11814 |
| Decile 8 | 0.10265 |
| Decile 7 | 0.0932064 |
| Decile 6 | 0.085766 |
| Median | 0.0792111 |
| Decile 4 | 0.072893 |
| Decile 3 | 0.066226 |
| Decile 2 | 0.0584391 |
| Decile 1 | 0.0477018 |
| Minimum | 0 |
|
|
- Mean = 0.082284
- Std.dev = 0.0337273
- 3469 items above graph maximum of 0.188578
|
2 Instances
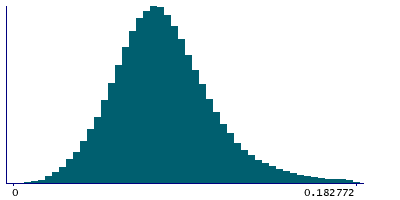
Instance 0 : Initial assessment visit (2006-2010) at which participants were recruited and consent given
486,148 participants, 486,148 items
| Maximum | 1.8478 |
| Decile 9 | 0.11884 |
| Decile 8 | 0.103301 |
| Decile 7 | 0.0938894 |
| Decile 6 | 0.0865015 |
| Median | 0.080013 |
| Decile 4 | 0.0737884 |
| Decile 3 | 0.0672681 |
| Decile 2 | 0.05967 |
| Decile 1 | 0.0491512 |
| Minimum | 0 |
|
|
- Mean = 0.0832207
- Std.dev = 0.0337137
- 3461 items above graph maximum of 0.188529
|
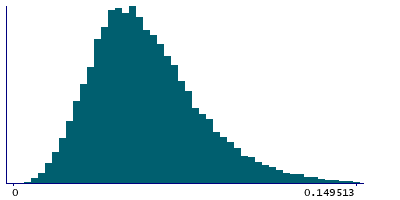
Instance 1 : First repeat assessment visit (2012-13)
19,849 participants, 19,849 items
| Maximum | 0.286299 |
| Decile 9 | 0.091404 |
| Decile 8 | 0.0774345 |
| Decile 7 | 0.068795 |
| Decile 6 | 0.0618275 |
| Median | 0.05581 |
| Decile 4 | 0.0502941 |
| Decile 3 | 0.044732 |
| Decile 2 | 0.0389295 |
| Decile 1 | 0.0314355 |
| Minimum | 0.0040161 |
|
|
- Mean = 0.0593408
- Std.dev = 0.0247415
- 81 items above graph maximum of 0.151372
|


