Data
507,924 items of data are available, covering 488,480 participants.
Defined-instances run from 0 to 1, labelled using Instancing
2.
Units of measurement are mmol/l.
| Maximum | 0.57205 |
| Decile 9 | 0.0847989 |
| Decile 8 | 0.077939 |
| Decile 7 | 0.073387 |
| Decile 6 | 0.069675 |
| Median | 0.066357 |
| Decile 4 | 0.0631678 |
| Decile 3 | 0.059887 |
| Decile 2 | 0.056198 |
| Decile 1 | 0.051301 |
| Minimum | 0.0033851 |
|
|
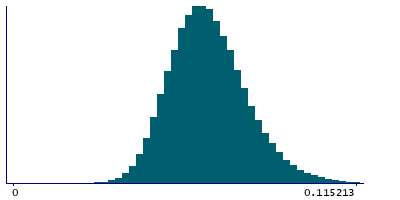
- Mean = 0.0674332
- Std.dev = 0.0134935
- 1053 items above graph maximum of 0.118297
|
2 Instances
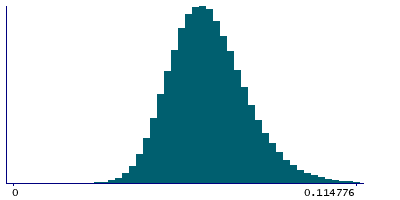
Instance 0 : Initial assessment visit (2006-2010) at which participants were recruited and consent given
488,049 participants, 488,049 items
| Maximum | 0.57205 |
| Decile 9 | 0.0847008 |
| Decile 8 | 0.0778469 |
| Decile 7 | 0.073291 |
| Decile 6 | 0.0695781 |
| Median | 0.0662647 |
| Decile 4 | 0.0630727 |
| Decile 3 | 0.059798 |
| Decile 2 | 0.056116 |
| Decile 1 | 0.051222 |
| Minimum | 0.0033851 |
|
|
- Mean = 0.0673423
- Std.dev = 0.0134873
- 1013 items above graph maximum of 0.11818
|
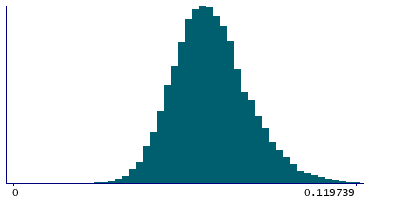
Instance 1 : First repeat assessment visit (2012-13)
19,875 participants, 19,875 items
| Maximum | 0.154942 |
| Decile 9 | 0.0871835 |
| Decile 8 | 0.080111 |
| Decile 7 | 0.0755826 |
| Decile 6 | 0.0719591 |
| Median | 0.068603 |
| Decile 4 | 0.0654434 |
| Decile 3 | 0.062191 |
| Decile 2 | 0.058528 |
| Decile 1 | 0.0535115 |
| Minimum | 0.020978 |
|
|
- Mean = 0.0696638
- Std.dev = 0.0134542
- 38 items above graph maximum of 0.120855
|


