Data
497,966 items of data are available, covering 479,247 participants.
Defined-instances run from 0 to 1, labelled using Instancing
2.
Units of measurement are mmol/l.
| Maximum | 0.94084 |
| Decile 9 | 0.0855587 |
| Decile 8 | 0.0787597 |
| Decile 7 | 0.074144 |
| Decile 6 | 0.070381 |
| Median | 0.066976 |
| Decile 4 | 0.0637519 |
| Decile 3 | 0.0605088 |
| Decile 2 | 0.056992 |
| Decile 1 | 0.0525326 |
| Minimum | 0.015113 |
|

|
- Mean = 0.0684904
- Std.dev = 0.0156394
- 2126 items above graph maximum of 0.118585
|
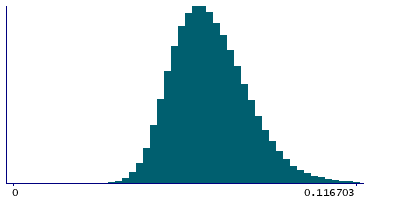
2 Instances
Instance 0 : Initial assessment visit (2006-2010) at which participants were recruited and consent given
478,489 participants, 478,489 items
| Maximum | 0.94084 |
| Decile 9 | 0.0855361 |
| Decile 8 | 0.078745 |
| Decile 7 | 0.0741292 |
| Decile 6 | 0.070366 |
| Median | 0.066957 |
| Decile 4 | 0.0637335 |
| Decile 3 | 0.060496 |
| Decile 2 | 0.056976 |
| Decile 1 | 0.052517 |
| Minimum | 0.0152653 |
|
|
- Mean = 0.0684765
- Std.dev = 0.0156612
- 2044 items above graph maximum of 0.118555
|
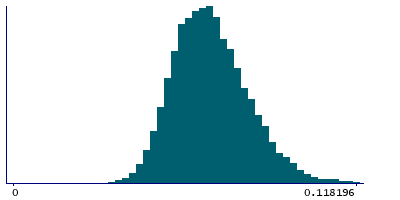
Instance 1 : First repeat assessment visit (2012-13)
19,477 participants, 19,477 items
| Maximum | 0.61543 |
| Decile 9 | 0.0861605 |
| Decile 8 | 0.079152 |
| Decile 7 | 0.0744691 |
| Decile 6 | 0.0707198 |
| Median | 0.0673975 |
| Decile 4 | 0.064187 |
| Decile 3 | 0.0608405 |
| Decile 2 | 0.05738 |
| Decile 1 | 0.0529702 |
| Minimum | 0.015113 |
|
|
- Mean = 0.0688313
- Std.dev = 0.0150892
- 78 items above graph maximum of 0.119351
|


