Data
507,960 items of data are available, covering 488,512 participants.
Defined-instances run from 0 to 1, labelled using Instancing
2.
Units of measurement are mmol/l.
| Maximum | 0.351801 |
| Decile 9 | 0.0637394 |
| Decile 8 | 0.049219 |
| Decile 7 | 0.039497 |
| Decile 6 | 0.0319759 |
| Median | 0.0256423 |
| Decile 4 | 0.0200371 |
| Decile 3 | 0.01486 |
| Decile 2 | 0.0098291 |
| Decile 1 | 0.0042516 |
| Minimum | 3.3795e-07 |
|
|
- Mean = 0.0308435
- Std.dev = 0.0241652
- 1937 items above graph maximum of 0.123227
|
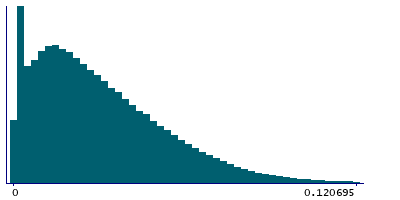
2 Instances
Instance 0 : Initial assessment visit (2006-2010) at which participants were recruited and consent given
488,083 participants, 488,083 items
| Maximum | 0.351801 |
| Decile 9 | 0.063937 |
| Decile 8 | 0.0493888 |
| Decile 7 | 0.039627 |
| Decile 6 | 0.032071 |
| Median | 0.0257059 |
| Decile 4 | 0.020075 |
| Decile 3 | 0.0148839 |
| Decile 2 | 0.00983505 |
| Decile 1 | 0.0042465 |
| Minimum | 3.3795e-07 |
|

|
- Mean = 0.0309343
- Std.dev = 0.0242531
- 1858 items above graph maximum of 0.123628
|
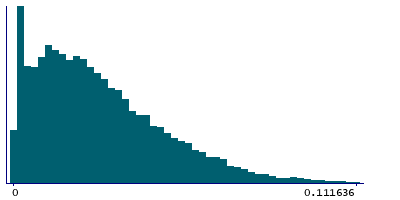
Instance 1 : First repeat assessment visit (2012-13)
19,877 participants, 19,877 items
| Maximum | 0.203031 |
| Decile 9 | 0.0583875 |
| Decile 8 | 0.0450825 |
| Decile 7 | 0.0363535 |
| Decile 6 | 0.0298039 |
| Median | 0.024218 |
| Decile 4 | 0.0191953 |
| Decile 3 | 0.014305 |
| Decile 2 | 0.0096941 |
| Decile 1 | 0.0043606 |
| Minimum | 0.00022481 |
|
|
- Mean = 0.0286147
- Std.dev = 0.0217794
- 69 items above graph maximum of 0.112414
|


