Data
507,960 items of data are available, covering 488,512 participants.
Defined-instances run from 0 to 1, labelled using Instancing
2.
Units of measurement are mmol/l.
| Maximum | 0.327252 |
| Decile 9 | 0.051326 |
| Decile 8 | 0.0390473 |
| Decile 7 | 0.0309443 |
| Decile 6 | 0.024762 |
| Median | 0.019737 |
| Decile 4 | 0.01547 |
| Decile 3 | 0.011698 |
| Decile 2 | 0.0080746 |
| Decile 1 | 0.00403862 |
| Minimum | 2.17906e-05 |
|

|
- Mean = 0.0245988
- Std.dev = 0.0198073
- 2727 items above graph maximum of 0.0986134
|
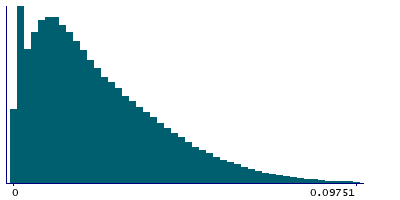
2 Instances
Instance 0 : Initial assessment visit (2006-2010) at which participants were recruited and consent given
488,083 participants, 488,083 items
| Maximum | 0.327252 |
| Decile 9 | 0.0514719 |
| Decile 8 | 0.039143 |
| Decile 7 | 0.0310186 |
| Decile 6 | 0.0247995 |
| Median | 0.0197532 |
| Decile 4 | 0.0154698 |
| Decile 3 | 0.011687 |
| Decile 2 | 0.0080554 |
| Decile 1 | 0.00401705 |
| Minimum | 2.17906e-05 |
|
|
- Mean = 0.0246414
- Std.dev = 0.0198741
- 2614 items above graph maximum of 0.0989267
|
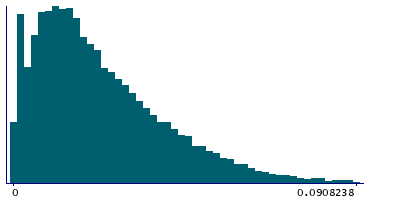
Instance 1 : First repeat assessment visit (2012-13)
19,877 participants, 19,877 items
| Maximum | 0.202001 |
| Decile 9 | 0.0478054 |
| Decile 8 | 0.0366825 |
| Decile 7 | 0.0294325 |
| Decile 6 | 0.02382 |
| Median | 0.019305 |
| Decile 4 | 0.0154845 |
| Decile 3 | 0.0119879 |
| Decile 2 | 0.00850785 |
| Decile 1 | 0.0046833 |
| Minimum | 0.0002455 |
|
|
- Mean = 0.0235545
- Std.dev = 0.0180578
- 103 items above graph maximum of 0.0909276
|


