Data
507,960 items of data are available, covering 488,512 participants.
Defined-instances run from 0 to 1, labelled using Instancing
2.
Units of measurement are mmol/l.
| Maximum | 0.51436 |
| Decile 9 | 0.124883 |
| Decile 8 | 0.1021 |
| Decile 7 | 0.086516 |
| Decile 6 | 0.0738405 |
| Median | 0.0626133 |
| Decile 4 | 0.0522089 |
| Decile 3 | 0.042195 |
| Decile 2 | 0.0319685 |
| Decile 1 | 0.020334 |
| Minimum | 2.2427e-08 |
|

|
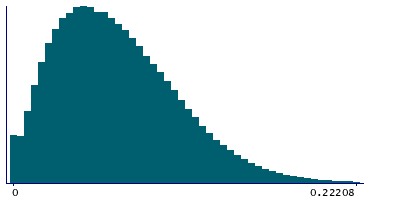
- Mean = 0.0687831
- Std.dev = 0.0418701
- 1218 items above graph maximum of 0.229433
|
2 Instances
Instance 0 : Initial assessment visit (2006-2010) at which participants were recruited and consent given
488,083 participants, 488,083 items
| Maximum | 0.51436 |
| Decile 9 | 0.125099 |
| Decile 8 | 0.102344 |
| Decile 7 | 0.0866854 |
| Decile 6 | 0.0739682 |
| Median | 0.062706 |
| Decile 4 | 0.0522708 |
| Decile 3 | 0.0422234 |
| Decile 2 | 0.031975 |
| Decile 1 | 0.0203264 |
| Minimum | 2.2427e-08 |
|
|
- Mean = 0.0688958
- Std.dev = 0.0419714
- 1169 items above graph maximum of 0.229872
|
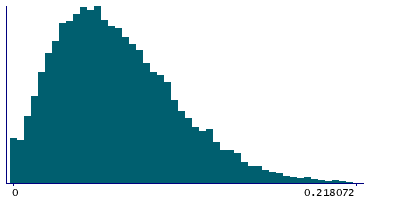
Instance 1 : First repeat assessment visit (2012-13)
19,877 participants, 19,877 items
| Maximum | 0.38394 |
| Decile 9 | 0.119095 |
| Decile 8 | 0.096755 |
| Decile 7 | 0.0823885 |
| Decile 6 | 0.0708165 |
| Median | 0.060377 |
| Decile 4 | 0.050767 |
| Decile 3 | 0.0414355 |
| Decile 2 | 0.031818 |
| Decile 1 | 0.0204745 |
| Minimum | 6.3402e-08 |
|
|
- Mean = 0.0660153
- Std.dev = 0.0391974
- 41 items above graph maximum of 0.217716
|


