Data
507,960 items of data are available, covering 488,512 participants.
Defined-instances run from 0 to 1, labelled using Instancing
2.
Units of measurement are mmol/l.
| Maximum | 0.558573 |
| Decile 9 | 0.16724 |
| Decile 8 | 0.141345 |
| Decile 7 | 0.12338 |
| Decile 6 | 0.108479 |
| Median | 0.0950674 |
| Decile 4 | 0.082495 |
| Decile 3 | 0.0698342 |
| Decile 2 | 0.0565097 |
| Decile 1 | 0.0405825 |
| Minimum | 4.60733e-05 |
|

|
- Mean = 0.100624
- Std.dev = 0.0499962
- 773 items above graph maximum of 0.293897
|
2 Instances
Instance 0 : Initial assessment visit (2006-2010) at which participants were recruited and consent given
488,083 participants, 488,083 items
| Maximum | 0.558573 |
| Decile 9 | 0.16748 |
| Decile 8 | 0.14157 |
| Decile 7 | 0.123581 |
| Decile 6 | 0.108626 |
| Median | 0.0951653 |
| Decile 4 | 0.0825654 |
| Decile 3 | 0.0698617 |
| Decile 2 | 0.0565371 |
| Decile 1 | 0.040563 |
| Minimum | 4.60733e-05 |
|

|
- Mean = 0.100745
- Std.dev = 0.0501013
- 744 items above graph maximum of 0.294397
|
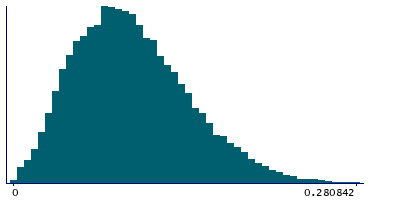
Instance 1 : First repeat assessment visit (2012-13)
19,877 participants, 19,877 items
| Maximum | 0.38802 |
| Decile 9 | 0.160691 |
| Decile 8 | 0.13571 |
| Decile 7 | 0.118472 |
| Decile 6 | 0.104762 |
| Median | 0.0926355 |
| Decile 4 | 0.080848 |
| Decile 3 | 0.0690915 |
| Decile 2 | 0.0559363 |
| Decile 1 | 0.041051 |
| Minimum | 0.0022121 |
|
|
- Mean = 0.0976408
- Std.dev = 0.0472448
- 27 items above graph maximum of 0.280332
|


