Data
507,960 items of data are available, covering 488,512 participants.
Defined-instances run from 0 to 1, labelled using Instancing
2.
Units of measurement are mmol/l.
| Maximum | 1.7276 |
| Decile 9 | 0.458125 |
| Decile 8 | 0.38739 |
| Decile 7 | 0.339561 |
| Decile 6 | 0.30109 |
| Median | 0.26739 |
| Decile 4 | 0.23628 |
| Decile 3 | 0.20654 |
| Decile 2 | 0.17618 |
| Decile 1 | 0.142373 |
| Minimum | 4.7431e-07 |
|

|
- Mean = 0.287466
- Std.dev = 0.127163
- 1334 items above graph maximum of 0.773877
|
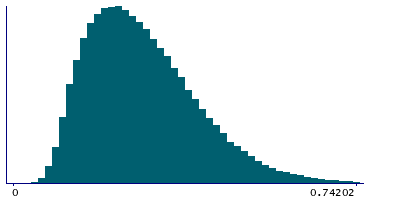
2 Instances
Instance 0 : Initial assessment visit (2006-2010) at which participants were recruited and consent given
488,083 participants, 488,083 items
| Maximum | 1.7276 |
| Decile 9 | 0.45882 |
| Decile 8 | 0.38798 |
| Decile 7 | 0.340021 |
| Decile 6 | 0.301379 |
| Median | 0.267595 |
| Decile 4 | 0.236396 |
| Decile 3 | 0.206548 |
| Decile 2 | 0.176127 |
| Decile 1 | 0.14231 |
| Minimum | 4.7431e-07 |
|
|
- Mean = 0.287726
- Std.dev = 0.127458
- 1274 items above graph maximum of 0.77533
|
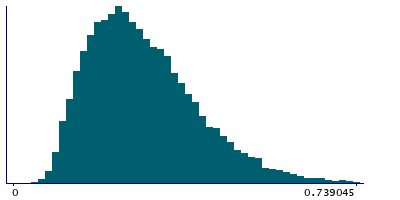
Instance 1 : First repeat assessment visit (2012-13)
19,877 participants, 19,877 items
| Maximum | 1.2332 |
| Decile 9 | 0.441525 |
| Decile 8 | 0.373385 |
| Decile 7 | 0.32955 |
| Decile 6 | 0.294615 |
| Median | 0.262447 |
| Decile 4 | 0.233515 |
| Decile 3 | 0.2064 |
| Decile 2 | 0.177442 |
| Decile 1 | 0.14424 |
| Minimum | 0.035465 |
|
|
- Mean = 0.281062
- Std.dev = 0.119494
- 44 items above graph maximum of 0.73881
|


