Data
507,960 items of data are available, covering 488,512 participants.
Defined-instances run from 0 to 1, labelled using Instancing
2.
Units of measurement are mmol/l.
| Maximum | 0.3841 |
| Decile 9 | 0.14019 |
| Decile 8 | 0.124292 |
| Decile 7 | 0.113485 |
| Decile 6 | 0.104684 |
| Median | 0.096867 |
| Decile 4 | 0.089312 |
| Decile 3 | 0.081572 |
| Decile 2 | 0.073062 |
| Decile 1 | 0.0622611 |
| Minimum | 0.010547 |
|

|
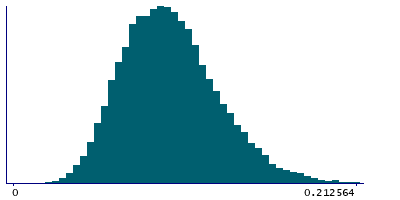
- Mean = 0.0995765
- Std.dev = 0.0309259
- 758 items above graph maximum of 0.218119
|
2 Instances
Instance 0 : Initial assessment visit (2006-2010) at which participants were recruited and consent given
488,083 participants, 488,083 items
| Maximum | 0.3841 |
| Decile 9 | 0.14031 |
| Decile 8 | 0.12441 |
| Decile 7 | 0.11358 |
| Decile 6 | 0.10476 |
| Median | 0.096936 |
| Decile 4 | 0.0893699 |
| Decile 3 | 0.081628 |
| Decile 2 | 0.0730977 |
| Decile 1 | 0.0622901 |
| Minimum | 0.010547 |
|

|
- Mean = 0.0996541
- Std.dev = 0.0309695
- 731 items above graph maximum of 0.21833
|
Instance 1 : First repeat assessment visit (2012-13)
19,877 participants, 19,877 items
| Maximum | 0.327478 |
| Decile 9 | 0.13701 |
| Decile 8 | 0.12156 |
| Decile 7 | 0.11106 |
| Decile 6 | 0.102678 |
| Median | 0.0951735 |
| Decile 4 | 0.0879205 |
| Decile 3 | 0.080175 |
| Decile 2 | 0.0721857 |
| Decile 1 | 0.061629 |
| Minimum | 0.018919 |
|
|
- Mean = 0.0976699
- Std.dev = 0.0297724
- 24 items above graph maximum of 0.212391
|


