Data
507,960 items of data are available, covering 488,512 participants.
Defined-instances run from 0 to 1, labelled using Instancing
2.
Units of measurement are mmol/l.
| Maximum | 0.228286 |
| Decile 9 | 0.0852462 |
| Decile 8 | 0.0753589 |
| Decile 7 | 0.0686369 |
| Decile 6 | 0.063154 |
| Median | 0.0582139 |
| Decile 4 | 0.053517 |
| Decile 3 | 0.048713 |
| Decile 2 | 0.043431 |
| Decile 1 | 0.0367007 |
| Minimum | 0.0029187 |
|

|
- Mean = 0.0599298
- Std.dev = 0.0192335
- 706 items above graph maximum of 0.133792
|
2 Instances
Instance 0 : Initial assessment visit (2006-2010) at which participants were recruited and consent given
488,083 participants, 488,083 items
| Maximum | 0.228286 |
| Decile 9 | 0.085314 |
| Decile 8 | 0.0754147 |
| Decile 7 | 0.068692 |
| Decile 6 | 0.063207 |
| Median | 0.0582593 |
| Decile 4 | 0.0535644 |
| Decile 3 | 0.048757 |
| Decile 2 | 0.043473 |
| Decile 1 | 0.03674 |
| Minimum | 0.0029187 |
|

|
- Mean = 0.0599798
- Std.dev = 0.0192478
- 679 items above graph maximum of 0.133888
|
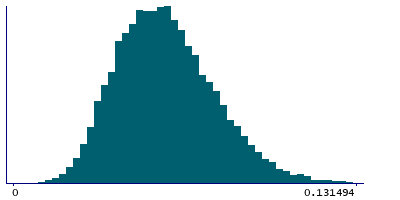
Instance 1 : First repeat assessment visit (2012-13)
19,877 participants, 19,877 items
| Maximum | 0.188638 |
| Decile 9 | 0.0837685 |
| Decile 8 | 0.0739754 |
| Decile 7 | 0.0672721 |
| Decile 6 | 0.061945 |
| Median | 0.0571778 |
| Decile 4 | 0.052447 |
| Decile 3 | 0.047632 |
| Decile 2 | 0.0423885 |
| Decile 1 | 0.0357515 |
| Minimum | 0.010379 |
|
|
- Mean = 0.0587034
- Std.dev = 0.0188382
- 26 items above graph maximum of 0.131785
|


