Data
507,960 items of data are available, covering 488,512 participants.
Defined-instances run from 0 to 1, labelled using Instancing
2.
Units of measurement are mmol/l.
| Maximum | 0.4288 |
| Decile 9 | 0.140968 |
| Decile 8 | 0.126701 |
| Decile 7 | 0.11716 |
| Decile 6 | 0.109631 |
| Median | 0.10298 |
| Decile 4 | 0.0966674 |
| Decile 3 | 0.0902644 |
| Decile 2 | 0.083206 |
| Decile 1 | 0.074041 |
| Minimum | 0.008033 |
|
|
- Mean = 0.105807
- Std.dev = 0.0270809
- 1292 items above graph maximum of 0.207895
|
2 Instances
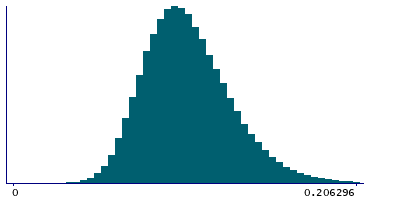
Instance 0 : Initial assessment visit (2006-2010) at which participants were recruited and consent given
488,083 participants, 488,083 items
| Maximum | 0.4288 |
| Decile 9 | 0.14102 |
| Decile 8 | 0.126733 |
| Decile 7 | 0.117174 |
| Decile 6 | 0.10964 |
| Median | 0.102984 |
| Decile 4 | 0.0966728 |
| Decile 3 | 0.090271 |
| Decile 2 | 0.0832112 |
| Decile 1 | 0.0740429 |
| Minimum | 0.008033 |
|

|
- Mean = 0.105831
- Std.dev = 0.0271161
- 1272 items above graph maximum of 0.207997
|
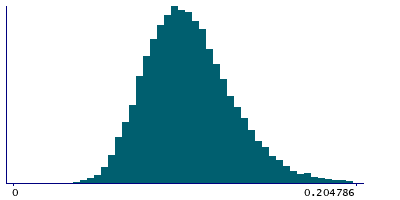
Instance 1 : First repeat assessment visit (2012-13)
19,877 participants, 19,877 items
| Maximum | 0.387863 |
| Decile 9 | 0.13963 |
| Decile 8 | 0.12596 |
| Decile 7 | 0.11671 |
| Decile 6 | 0.10941 |
| Median | 0.102912 |
| Decile 4 | 0.0965305 |
| Decile 3 | 0.090119 |
| Decile 2 | 0.083058 |
| Decile 1 | 0.0739855 |
| Minimum | 0.029942 |
|
|
- Mean = 0.105226
- Std.dev = 0.0261964
- 23 items above graph maximum of 0.205274
|


