Data
507,960 items of data are available, covering 488,512 participants.
Defined-instances run from 0 to 1, labelled using Instancing
2.
Units of measurement are mmol/l.
| Maximum | 0.46397 |
| Decile 9 | 0.099661 |
| Decile 8 | 0.0868108 |
| Decile 7 | 0.0788694 |
| Decile 6 | 0.0728273 |
| Median | 0.0676303 |
| Decile 4 | 0.062817 |
| Decile 3 | 0.057994 |
| Decile 2 | 0.052789 |
| Decile 1 | 0.0461443 |
| Minimum | 0.005095 |
|
|
- Mean = 0.0709385
- Std.dev = 0.022459
- 2661 items above graph maximum of 0.153178
|
2 Instances
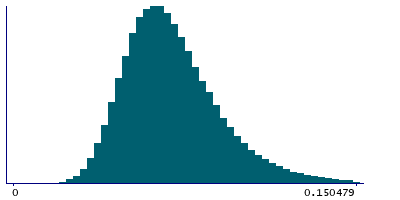
Instance 0 : Initial assessment visit (2006-2010) at which participants were recruited and consent given
488,083 participants, 488,083 items
| Maximum | 0.46397 |
| Decile 9 | 0.0998241 |
| Decile 8 | 0.086901 |
| Decile 7 | 0.0789148 |
| Decile 6 | 0.0728434 |
| Median | 0.067622 |
| Decile 4 | 0.062785 |
| Decile 3 | 0.057946 |
| Decile 2 | 0.05273 |
| Decile 1 | 0.0460848 |
| Minimum | 0.005095 |
|

|
- Mean = 0.0709615
- Std.dev = 0.0225545
- 2577 items above graph maximum of 0.153563
|
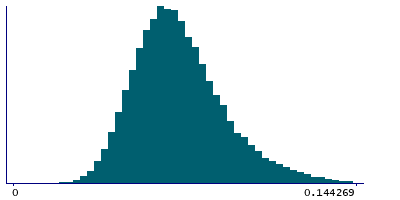
Instance 1 : First repeat assessment visit (2012-13)
19,877 participants, 19,877 items
| Maximum | 0.300283 |
| Decile 9 | 0.0962184 |
| Decile 8 | 0.084806 |
| Decile 7 | 0.0778077 |
| Decile 6 | 0.0724075 |
| Median | 0.067854 |
| Decile 4 | 0.0633872 |
| Decile 3 | 0.0590705 |
| Decile 2 | 0.0541115 |
| Decile 1 | 0.0477421 |
| Minimum | 0.0172383 |
|
|
- Mean = 0.0703739
- Std.dev = 0.0199646
- 87 items above graph maximum of 0.144695
|


