Data
507,960 items of data are available, covering 488,512 participants.
Defined-instances run from 0 to 1, labelled using Instancing
2.
Units of measurement are mmol/l.
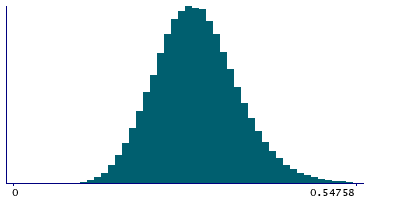
| Maximum | 0.959633 |
| Decile 9 | 0.3826 |
| Decile 8 | 0.34973 |
| Decile 7 | 0.327334 |
| Decile 6 | 0.30887 |
| Median | 0.292194 |
| Decile 4 | 0.275702 |
| Decile 3 | 0.258425 |
| Decile 2 | 0.23891 |
| Decile 1 | 0.21216 |
| Minimum | 0.04955 |
|
|
- Mean = 0.295668
- Std.dev = 0.0674847
- 648 items above graph maximum of 0.55304
|
2 Instances
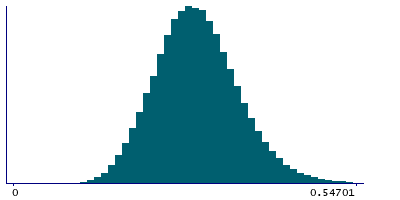
Instance 0 : Initial assessment visit (2006-2010) at which participants were recruited and consent given
488,083 participants, 488,083 items
| Maximum | 0.959633 |
| Decile 9 | 0.382618 |
| Decile 8 | 0.34973 |
| Decile 7 | 0.32733 |
| Decile 6 | 0.30891 |
| Median | 0.292259 |
| Decile 4 | 0.275814 |
| Decile 3 | 0.258567 |
| Decile 2 | 0.239121 |
| Decile 1 | 0.212462 |
| Minimum | 0.04955 |
|
|
- Mean = 0.295773
- Std.dev = 0.0673879
- 626 items above graph maximum of 0.552775
|
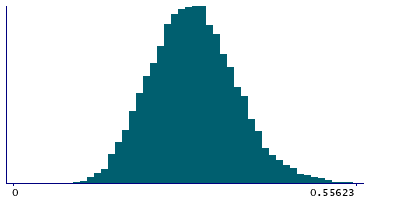
Instance 1 : First repeat assessment visit (2012-13)
19,877 participants, 19,877 items
| Maximum | 0.66843 |
| Decile 9 | 0.38226 |
| Decile 8 | 0.349835 |
| Decile 7 | 0.32743 |
| Decile 6 | 0.308 |
| Median | 0.29064 |
| Decile 4 | 0.272647 |
| Decile 3 | 0.254465 |
| Decile 2 | 0.233195 |
| Decile 1 | 0.204945 |
| Minimum | 0.0877717 |
|
|
- Mean = 0.293104
- Std.dev = 0.0697702
- 26 items above graph maximum of 0.559575
|


