Data
507,960 items of data are available, covering 488,512 participants.
Defined-instances run from 0 to 1, labelled using Instancing
2.
Units of measurement are mmol/l.
| Maximum | 0.00253103 |
| Decile 9 | 0.00098677 |
| Decile 8 | 0.00089356 |
| Decile 7 | 0.00083075 |
| Decile 6 | 0.000778954 |
| Median | 0.000732936 |
| Decile 4 | 0.000688819 |
| Decile 3 | 0.00064374 |
| Decile 2 | 0.000593753 |
| Decile 1 | 0.000529335 |
| Minimum | 8.8605e-05 |
|
|
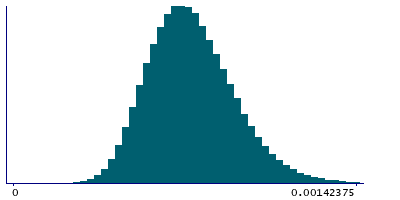
- Mean = 0.000748333
- Std.dev = 0.000181375
- 680 items above graph maximum of 0.00144421
|
2 Instances
Instance 0 : Initial assessment visit (2006-2010) at which participants were recruited and consent given
488,083 participants, 488,083 items
| Maximum | 0.00253103 |
| Decile 9 | 0.000987312 |
| Decile 8 | 0.000894045 |
| Decile 7 | 0.00083117 |
| Decile 6 | 0.00077935 |
| Median | 0.000733307 |
| Decile 4 | 0.00068922 |
| Decile 3 | 0.00064414 |
| Decile 2 | 0.00059424 |
| Decile 1 | 0.000529908 |
| Minimum | 8.8605e-05 |
|
|
- Mean = 0.000748799
- Std.dev = 0.00018141
- 653 items above graph maximum of 0.00144472
|
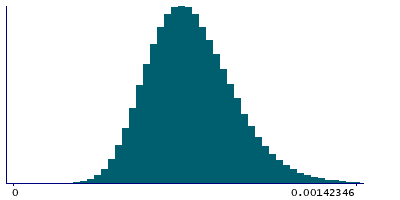
Instance 1 : First repeat assessment visit (2012-13)
19,877 participants, 19,877 items
| Maximum | 0.00177891 |
| Decile 9 | 0.000973715 |
| Decile 8 | 0.00088188 |
| Decile 7 | 0.000819955 |
| Decile 6 | 0.000767827 |
| Median | 0.000724125 |
| Decile 4 | 0.000679405 |
| Decile 3 | 0.000633995 |
| Decile 2 | 0.000581395 |
| Decile 1 | 0.000514875 |
| Minimum | 0.00021702 |
|

|
- Mean = 0.000736901
- Std.dev = 0.000180114
- 28 items above graph maximum of 0.00143255
|


