Data
507,960 items of data are available, covering 488,512 participants.
Defined-instances run from 0 to 1, labelled using Instancing
2.
Units of measurement are mmol/l.
| Maximum | 5.53837 |
| Decile 9 | 2.1206 |
| Decile 8 | 1.9293 |
| Decile 7 | 1.801 |
| Decile 6 | 1.6938 |
| Median | 1.59713 |
| Decile 4 | 1.5034 |
| Decile 3 | 1.4051 |
| Decile 2 | 1.2945 |
| Decile 1 | 1.1467 |
| Minimum | 0.118792 |
|
|
- Mean = 1.61975
- Std.dev = 0.387193
- 609 items above graph maximum of 3.0945
|
2 Instances
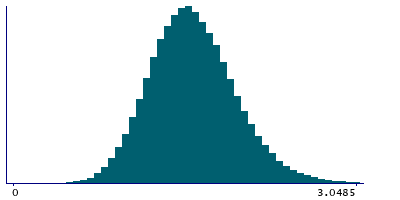
Instance 0 : Initial assessment visit (2006-2010) at which participants were recruited and consent given
488,083 participants, 488,083 items
| Maximum | 5.53837 |
| Decile 9 | 2.1215 |
| Decile 8 | 1.9302 |
| Decile 7 | 1.8019 |
| Decile 6 | 1.69484 |
| Median | 1.5981 |
| Decile 4 | 1.5045 |
| Decile 3 | 1.4063 |
| Decile 2 | 1.2958 |
| Decile 1 | 1.1483 |
| Minimum | 0.118792 |
|

|
- Mean = 1.62085
- Std.dev = 0.38698
- 579 items above graph maximum of 3.0947
|
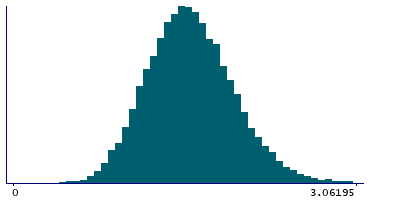
Instance 1 : First repeat assessment visit (2012-13)
19,877 participants, 19,877 items
| Maximum | 3.95061 |
| Decile 9 | 2.0929 |
| Decile 8 | 1.90742 |
| Decile 7 | 1.7791 |
| Decile 6 | 1.66785 |
| Median | 1.57155 |
| Decile 4 | 1.47828 |
| Decile 3 | 1.37865 |
| Decile 2 | 1.2615 |
| Decile 1 | 1.11249 |
| Minimum | 0.20476 |
|
|
- Mean = 1.59295
- Std.dev = 0.391436
- 31 items above graph maximum of 3.07331
|


