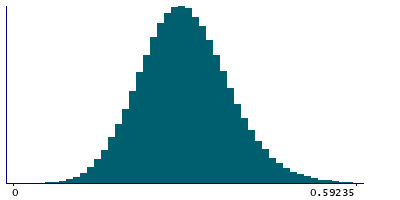
Data
507,960 items of data are available, covering 488,512 participants.
Defined-instances run from 0 to 1, labelled using Instancing
2.
Units of measurement are mmol/l.
| Maximum | 1.11829 |
| Decile 9 | 0.40172 |
| Decile 8 | 0.36405 |
| Decile 7 | 0.338416 |
| Decile 6 | 0.317114 |
| Median | 0.29759 |
| Decile 4 | 0.27831 |
| Decile 3 | 0.258173 |
| Decile 2 | 0.23493 |
| Decile 1 | 0.20339 |
| Minimum | 0 |
|
|
- Mean = 0.300753
- Std.dev = 0.078685
- 504 items above graph maximum of 0.60005
|
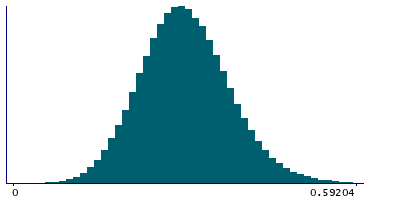
2 Instances
Instance 0 : Initial assessment visit (2006-2010) at which participants were recruited and consent given
488,083 participants, 488,083 items
| Maximum | 1.11829 |
| Decile 9 | 0.401839 |
| Decile 8 | 0.364184 |
| Decile 7 | 0.338537 |
| Decile 6 | 0.317272 |
| Median | 0.297747 |
| Decile 4 | 0.278509 |
| Decile 3 | 0.25843 |
| Decile 2 | 0.23522 |
| Decile 1 | 0.20373 |
| Minimum | 0 |
|
|
- Mean = 0.300934
- Std.dev = 0.0786068
- 475 items above graph maximum of 0.599949
|
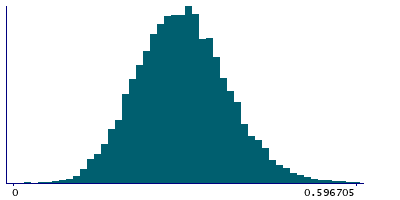
Instance 1 : First repeat assessment visit (2012-13)
19,877 participants, 19,877 items
| Maximum | 0.76627 |
| Decile 9 | 0.39842 |
| Decile 8 | 0.361053 |
| Decile 7 | 0.335555 |
| Decile 6 | 0.31322 |
| Median | 0.293772 |
| Decile 4 | 0.27336 |
| Decile 3 | 0.25222 |
| Decile 2 | 0.227875 |
| Decile 1 | 0.196165 |
| Minimum | 0.0016515 |
|
|
- Mean = 0.296302
- Std.dev = 0.0804532
- 29 items above graph maximum of 0.600675
|


