Data
507,960 items of data are available, covering 488,512 participants.
Defined-instances run from 0 to 1, labelled using Instancing
2.
Units of measurement are mmol/l.
| Maximum | 0.41368 |
| Decile 9 | 0.178273 |
| Decile 8 | 0.161 |
| Decile 7 | 0.149175 |
| Decile 6 | 0.13961 |
| Median | 0.131046 |
| Decile 4 | 0.122712 |
| Decile 3 | 0.11423 |
| Decile 2 | 0.104729 |
| Decile 1 | 0.0925277 |
| Minimum | 2.16368e-14 |
|

|
- Mean = 0.133703
- Std.dev = 0.0339431
- 584 items above graph maximum of 0.264017
|
2 Instances
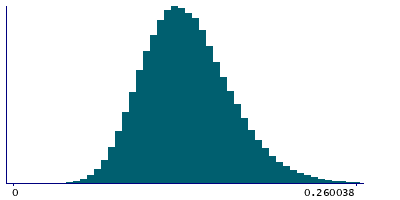
Instance 0 : Initial assessment visit (2006-2010) at which participants were recruited and consent given
488,083 participants, 488,083 items
| Maximum | 0.41368 |
| Decile 9 | 0.178428 |
| Decile 8 | 0.16112 |
| Decile 7 | 0.149277 |
| Decile 6 | 0.13971 |
| Median | 0.13114 |
| Decile 4 | 0.122805 |
| Decile 3 | 0.11431 |
| Decile 2 | 0.104816 |
| Decile 1 | 0.092617 |
| Minimum | 2.16368e-14 |
|
|
- Mean = 0.133807
- Std.dev = 0.0339744
- 553 items above graph maximum of 0.264239
|
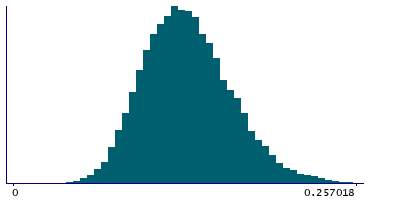
Instance 1 : First repeat assessment visit (2012-13)
19,877 participants, 19,877 items
| Maximum | 0.30563 |
| Decile 9 | 0.174117 |
| Decile 8 | 0.158034 |
| Decile 7 | 0.146615 |
| Decile 6 | 0.137245 |
| Median | 0.12879 |
| Decile 4 | 0.120531 |
| Decile 3 | 0.112109 |
| Decile 2 | 0.102715 |
| Decile 1 | 0.0906684 |
| Minimum | 0.03217 |
|
|
- Mean = 0.131133
- Std.dev = 0.0330614
- 26 items above graph maximum of 0.257566
|


