Data
507,960 items of data are available, covering 488,512 participants.
Defined-instances run from 0 to 1, labelled using Instancing
2.
Units of measurement are mmol/l.
| Maximum | 0.119361 |
| Decile 9 | 0.023718 |
| Decile 8 | 0.019862 |
| Decile 7 | 0.0175393 |
| Decile 6 | 0.0158359 |
| Median | 0.014461 |
| Decile 4 | 0.013267 |
| Decile 3 | 0.0121624 |
| Decile 2 | 0.0110503 |
| Decile 1 | 0.0097591 |
| Minimum | 0.0025891 |
|

|
- Mean = 0.0158344
- Std.dev = 0.00603234
- 3674 items above graph maximum of 0.0376769
|
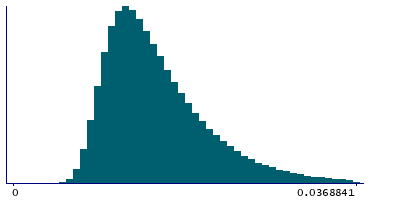
2 Instances
Instance 0 : Initial assessment visit (2006-2010) at which participants were recruited and consent given
488,083 participants, 488,083 items
| Maximum | 0.119361 |
| Decile 9 | 0.023771 |
| Decile 8 | 0.019897 |
| Decile 7 | 0.017564 |
| Decile 6 | 0.015847 |
| Median | 0.014466 |
| Decile 4 | 0.013266 |
| Decile 3 | 0.012156 |
| Decile 2 | 0.0110413 |
| Decile 1 | 0.00974964 |
| Minimum | 0.0025891 |
|
|
- Mean = 0.0158496
- Std.dev = 0.00605965
- 3540 items above graph maximum of 0.0377924
|
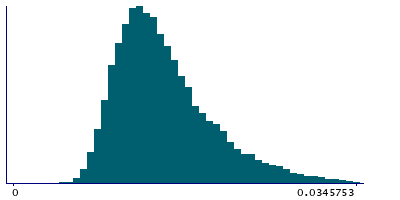
Instance 1 : First repeat assessment visit (2012-13)
19,877 participants, 19,877 items
| Maximum | 0.0639105 |
| Decile 9 | 0.022306 |
| Decile 8 | 0.0190516 |
| Decile 7 | 0.0170213 |
| Decile 6 | 0.015574 |
| Median | 0.014367 |
| Decile 4 | 0.013294 |
| Decile 3 | 0.0122997 |
| Decile 2 | 0.011249 |
| Decile 1 | 0.00998082 |
| Minimum | 0.0043468 |
|
|
- Mean = 0.015459
- Std.dev = 0.00530414
- 147 items above graph maximum of 0.0346312
|


