Data
507,960 items of data are available, covering 488,512 participants.
Defined-instances run from 0 to 1, labelled using Instancing
2.
Units of measurement are mmol/l.
| Maximum | 0.35319 |
| Decile 9 | 0.096953 |
| Decile 8 | 0.078187 |
| Decile 7 | 0.0665119 |
| Decile 6 | 0.058106 |
| Median | 0.05161 |
| Decile 4 | 0.046059 |
| Decile 3 | 0.040874 |
| Decile 2 | 0.0354619 |
| Decile 1 | 0.0284912 |
| Minimum | 1.9777e-09 |
|

|
- Mean = 0.0579811
- Std.dev = 0.0287033
- 2359 items above graph maximum of 0.165415
|
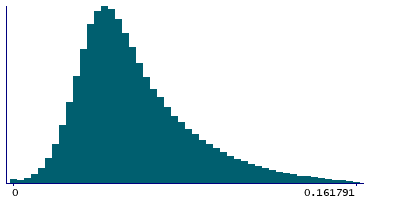
2 Instances
Instance 0 : Initial assessment visit (2006-2010) at which participants were recruited and consent given
488,083 participants, 488,083 items
| Maximum | 0.35319 |
| Decile 9 | 0.0965465 |
| Decile 8 | 0.0778586 |
| Decile 7 | 0.0662468 |
| Decile 6 | 0.0578929 |
| Median | 0.051438 |
| Decile 4 | 0.0459288 |
| Decile 3 | 0.0407775 |
| Decile 2 | 0.0353892 |
| Decile 1 | 0.02844 |
| Minimum | 1.9777e-09 |
|
|
- Mean = 0.0577853
- Std.dev = 0.0285864
- 2320 items above graph maximum of 0.164653
|
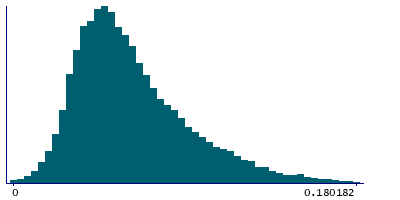
Instance 1 : First repeat assessment visit (2012-13)
19,877 participants, 19,877 items
| Maximum | 0.237787 |
| Decile 9 | 0.105906 |
| Decile 8 | 0.085824 |
| Decile 7 | 0.073047 |
| Decile 6 | 0.063639 |
| Median | 0.0561475 |
| Decile 4 | 0.0497115 |
| Decile 3 | 0.04376 |
| Decile 2 | 0.0375255 |
| Decile 1 | 0.029961 |
| Minimum | 7.1609e-09 |
|
|
- Mean = 0.0627893
- Std.dev = 0.0310521
- 58 items above graph maximum of 0.181851
|


