Data
507,960 items of data are available, covering 488,512 participants.
Defined-instances run from 0 to 1, labelled using Instancing
2.
Units of measurement are mmol/l.
| Maximum | 0.0592226 |
| Decile 9 | 0.0107815 |
| Decile 8 | 0.0091934 |
| Decile 7 | 0.0082014 |
| Decile 6 | 0.0074488 |
| Median | 0.0067994 |
| Decile 4 | 0.0062039 |
| Decile 3 | 0.00561882 |
| Decile 2 | 0.0049937 |
| Decile 1 | 0.004206 |
| Minimum | 2.3025e-06 |
|
|
- Mean = 0.00724308
- Std.dev = 0.00279131
- 3047 items above graph maximum of 0.017357
|
2 Instances
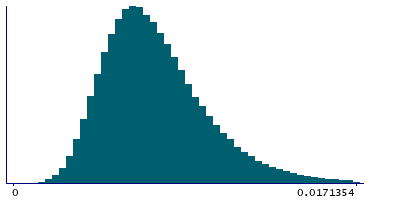
Instance 0 : Initial assessment visit (2006-2010) at which participants were recruited and consent given
488,083 participants, 488,083 items
| Maximum | 0.0592226 |
| Decile 9 | 0.010793 |
| Decile 8 | 0.00919746 |
| Decile 7 | 0.00820284 |
| Decile 6 | 0.0074475 |
| Median | 0.0067977 |
| Decile 4 | 0.0062009 |
| Decile 3 | 0.0056149 |
| Decile 2 | 0.0049895 |
| Decile 1 | 0.0042014 |
| Minimum | 2.3025e-06 |
|

|
- Mean = 0.00724458
- Std.dev = 0.00280015
- 2951 items above graph maximum of 0.0173846
|
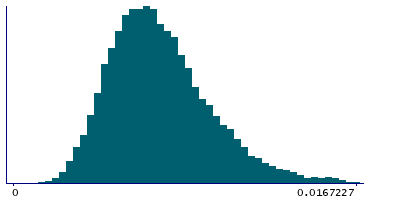
Instance 1 : First repeat assessment visit (2012-13)
19,877 participants, 19,877 items
| Maximum | 0.0302967 |
| Decile 9 | 0.0105395 |
| Decile 8 | 0.00909236 |
| Decile 7 | 0.0081725 |
| Decile 6 | 0.0074744 |
| Median | 0.00684418 |
| Decile 4 | 0.00628555 |
| Decile 3 | 0.00570179 |
| Decile 2 | 0.00509225 |
| Decile 1 | 0.00432495 |
| Minimum | 0.00038809 |
|
|
- Mean = 0.00720607
- Std.dev = 0.00256421
- 82 items above graph maximum of 0.016754
|


