Data
507,960 items of data are available, covering 488,512 participants.
Defined-instances run from 0 to 1, labelled using Instancing
2.
Units of measurement are mmol/l.
| Maximum | 3.4418 |
| Decile 9 | 1.1236 |
| Decile 8 | 0.91604 |
| Decile 7 | 0.77766 |
| Decile 6 | 0.670973 |
| Median | 0.5838 |
| Decile 4 | 0.50859 |
| Decile 3 | 0.44106 |
| Decile 2 | 0.37526 |
| Decile 1 | 0.30075 |
| Minimum | 0.011645 |
|

|
- Mean = 0.657444
- Std.dev = 0.333676
- 1223 items above graph maximum of 1.94645
|
2 Instances
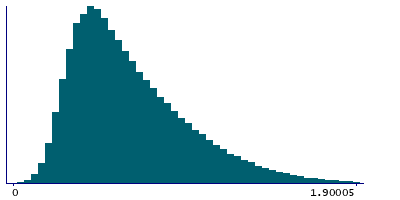
Instance 0 : Initial assessment visit (2006-2010) at which participants were recruited and consent given
488,083 participants, 488,083 items
| Maximum | 3.4418 |
| Decile 9 | 1.1201 |
| Decile 8 | 0.912907 |
| Decile 7 | 0.774802 |
| Decile 6 | 0.66853 |
| Median | 0.581726 |
| Decile 4 | 0.50679 |
| Decile 3 | 0.439651 |
| Decile 2 | 0.374083 |
| Decile 1 | 0.299833 |
| Minimum | 0.011645 |
|
|
- Mean = 0.655337
- Std.dev = 0.332879
- 1198 items above graph maximum of 1.94037
|
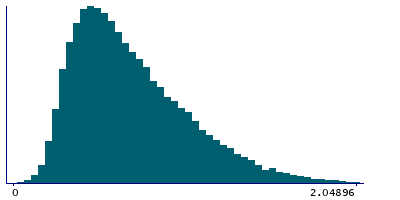
Instance 1 : First repeat assessment visit (2012-13)
19,877 participants, 19,877 items
| Maximum | 2.8402 |
| Decile 9 | 1.1971 |
| Decile 8 | 0.98937 |
| Decile 7 | 0.843325 |
| Decile 6 | 0.73394 |
| Median | 0.636655 |
| Decile 4 | 0.55557 |
| Decile 3 | 0.480853 |
| Decile 2 | 0.407965 |
| Decile 1 | 0.326718 |
| Minimum | 0.035608 |
|
|
- Mean = 0.70919
- Std.dev = 0.348705
- 33 items above graph maximum of 2.06748
|


