Data
507,960 items of data are available, covering 488,512 participants.
Defined-instances run from 0 to 1, labelled using Instancing
2.
Units of measurement are mmol/l.
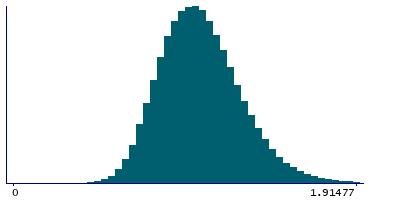
| Maximum | 3.20999 |
| Decile 9 | 1.36223 |
| Decile 8 | 1.2447 |
| Decile 7 | 1.16481 |
| Decile 6 | 1.09991 |
| Median | 1.04173 |
| Decile 4 | 0.985391 |
| Decile 3 | 0.92774 |
| Decile 2 | 0.86423 |
| Decile 1 | 0.78195 |
| Minimum | 0.01696 |
|

|
- Mean = 1.06071
- Std.dev = 0.231808
- 856 items above graph maximum of 1.94252
|
2 Instances
Instance 0 : Initial assessment visit (2006-2010) at which participants were recruited and consent given
488,083 participants, 488,083 items
| Maximum | 3.20999 |
| Decile 9 | 1.36147 |
| Decile 8 | 1.244 |
| Decile 7 | 1.1639 |
| Decile 6 | 1.0991 |
| Median | 1.04089 |
| Decile 4 | 0.98449 |
| Decile 3 | 0.92692 |
| Decile 2 | 0.863438 |
| Decile 1 | 0.78112 |
| Minimum | 0.01696 |
|
|
- Mean = 1.05991
- Std.dev = 0.231848
- 817 items above graph maximum of 1.94182
|
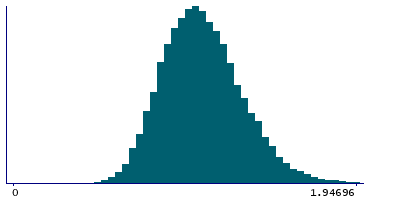
Instance 1 : First repeat assessment visit (2012-13)
19,877 participants, 19,877 items
| Maximum | 2.7685 |
| Decile 9 | 1.37865 |
| Decile 8 | 1.26205 |
| Decile 7 | 1.1852 |
| Decile 6 | 1.12145 |
| Median | 1.0618 |
| Decile 4 | 1.0064 |
| Decile 3 | 0.948285 |
| Decile 2 | 0.88432 |
| Decile 1 | 0.80337 |
| Minimum | 0.39011 |
|
|
- Mean = 1.08031
- Std.dev = 0.229954
- 39 items above graph maximum of 1.95393
|


