Data
507,960 items of data are available, covering 488,512 participants.
Defined-instances run from 0 to 1, labelled using Instancing
2.
Units of measurement are mmol/l.
| Maximum | 2.89268 |
| Decile 9 | 1.392 |
| Decile 8 | 1.31229 |
| Decile 7 | 1.2586 |
| Decile 6 | 1.21485 |
| Median | 1.175 |
| Decile 4 | 1.1364 |
| Decile 3 | 1.09632 |
| Decile 2 | 1.0503 |
| Decile 1 | 0.98815 |
| Minimum | 0.215705 |
|
|
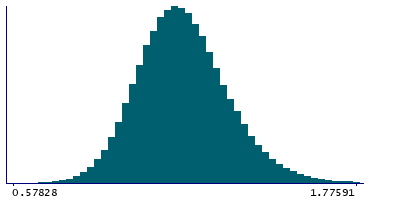
- Mean = 1.18474
- Std.dev = 0.163482
- 93 items below graph minimum of 0.5843
- 1065 items above graph maximum of 1.79585
|
2 Instances
Instance 0 : Initial assessment visit (2006-2010) at which participants were recruited and consent given
488,083 participants, 488,083 items
| Maximum | 2.89268 |
| Decile 9 | 1.3923 |
| Decile 8 | 1.3126 |
| Decile 7 | 1.2589 |
| Decile 6 | 1.2151 |
| Median | 1.17519 |
| Decile 4 | 1.13663 |
| Decile 3 | 1.0965 |
| Decile 2 | 1.0504 |
| Decile 1 | 0.988312 |
| Minimum | 0.215705 |
|
|
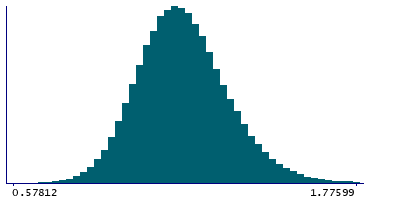
- Mean = 1.18496
- Std.dev = 0.163488
- 92 items below graph minimum of 0.584323
- 1001 items above graph maximum of 1.79629
|
Instance 1 : First repeat assessment visit (2012-13)
19,877 participants, 19,877 items
| Maximum | 2.4199 |
| Decile 9 | 1.3829 |
| Decile 8 | 1.3034 |
| Decile 7 | 1.2518 |
| Decile 6 | 1.20857 |
| Median | 1.1703 |
| Decile 4 | 1.132 |
| Decile 3 | 1.09154 |
| Decile 2 | 1.0474 |
| Decile 1 | 0.983895 |
| Minimum | 0.49319 |
|
|
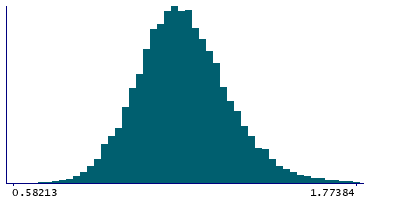
- Mean = 1.17935
- Std.dev = 0.163224
- 2 items below graph minimum of 0.58489
- 60 items above graph maximum of 1.78191
|


