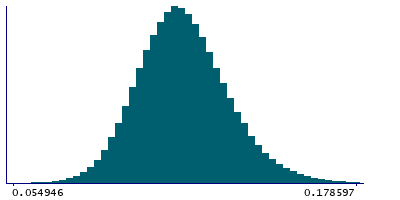
Data
507,960 items of data are available, covering 488,512 participants.
Defined-instances run from 0 to 1, labelled using Instancing
2.
Units of measurement are mmol/l.
| Maximum | 0.303374 |
| Decile 9 | 0.139071 |
| Decile 8 | 0.131 |
| Decile 7 | 0.12549 |
| Decile 6 | 0.120967 |
| Median | 0.1169 |
| Decile 4 | 0.11294 |
| Decile 3 | 0.10877 |
| Decile 2 | 0.10398 |
| Decile 1 | 0.097453 |
| Minimum | 0.000868117 |
|
|
- Mean = 0.11779
- Std.dev = 0.0168312
- 49 items below graph minimum of 0.0558351
- 1005 items above graph maximum of 0.180689
|
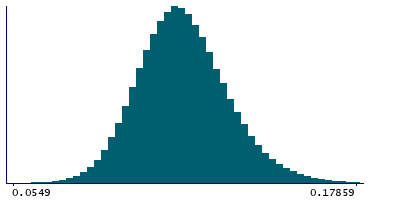
2 Instances
Instance 0 : Initial assessment visit (2006-2010) at which participants were recruited and consent given
488,083 participants, 488,083 items
| Maximum | 0.303374 |
| Decile 9 | 0.1391 |
| Decile 8 | 0.131017 |
| Decile 7 | 0.1255 |
| Decile 6 | 0.120975 |
| Median | 0.11691 |
| Decile 4 | 0.11295 |
| Decile 3 | 0.10877 |
| Decile 2 | 0.10399 |
| Decile 1 | 0.0974612 |
| Minimum | 0.000868117 |
|
|
- Mean = 0.117801
- Std.dev = 0.0168287
- 48 items below graph minimum of 0.0558225
- 943 items above graph maximum of 0.180739
|
Instance 1 : First repeat assessment visit (2012-13)
19,877 participants, 19,877 items
| Maximum | 0.23816 |
| Decile 9 | 0.138315 |
| Decile 8 | 0.13056 |
| Decile 7 | 0.12521 |
| Decile 6 | 0.120772 |
| Median | 0.11667 |
| Decile 4 | 0.11281 |
| Decile 3 | 0.108654 |
| Decile 2 | 0.10375 |
| Decile 1 | 0.0971585 |
| Minimum | 0.049555 |
|

|
- Mean = 0.117525
- Std.dev = 0.0168916
- 1 item below graph minimum of 0.056002
- 61 items above graph maximum of 0.179471
|


