Data
507,960 items of data are available, covering 488,512 participants.
Defined-instances run from 0 to 1, labelled using Instancing
2.
Units of measurement are mmol/l.
| Maximum | 0.325 |
| Decile 9 | 0.077814 |
| Decile 8 | 0.06784 |
| Decile 7 | 0.0614611 |
| Decile 6 | 0.056424 |
| Median | 0.0519999 |
| Decile 4 | 0.04778 |
| Decile 3 | 0.043459 |
| Decile 2 | 0.038645 |
| Decile 1 | 0.0323625 |
| Minimum | 0.000711564 |
|

|
- Mean = 0.0539884
- Std.dev = 0.0185699
- 1718 items above graph maximum of 0.123266
|
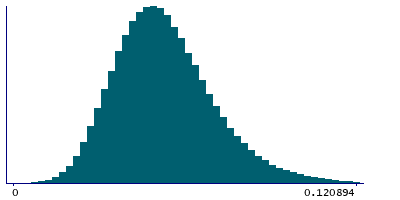
2 Instances
Instance 0 : Initial assessment visit (2006-2010) at which participants were recruited and consent given
488,083 participants, 488,083 items
| Maximum | 0.325 |
| Decile 9 | 0.0779455 |
| Decile 8 | 0.0679441 |
| Decile 7 | 0.061545 |
| Decile 6 | 0.0564868 |
| Median | 0.052051 |
| Decile 4 | 0.0478201 |
| Decile 3 | 0.043486 |
| Decile 2 | 0.0386581 |
| Decile 1 | 0.032375 |
| Minimum | 0.000711564 |
|
|
- Mean = 0.0540541
- Std.dev = 0.018623
- 1660 items above graph maximum of 0.123516
|
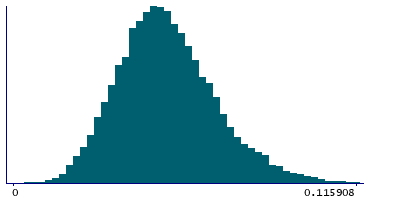
Instance 1 : First repeat assessment visit (2012-13)
19,877 participants, 19,877 items
| Maximum | 0.17739 |
| Decile 9 | 0.074354 |
| Decile 8 | 0.0654852 |
| Decile 7 | 0.059611 |
| Decile 6 | 0.0549305 |
| Median | 0.050823 |
| Decile 4 | 0.0468343 |
| Decile 3 | 0.0427916 |
| Decile 2 | 0.0382765 |
| Decile 1 | 0.0321185 |
| Minimum | 0.00171687 |
|
|
- Mean = 0.0523746
- Std.dev = 0.0171347
- 59 items above graph maximum of 0.116589
|


