Data
486,620 items of data are available, covering 468,668 participants.
Defined-instances run from 0 to 1, labelled using Instancing
2.
Units of measurement are percent.
| Maximum | 97.7793 |
| Decile 9 | 65.634 |
| Decile 8 | 62.933 |
| Decile 7 | 61.138 |
| Decile 6 | 59.5548 |
| Median | 57.9457 |
| Decile 4 | 56.0556 |
| Decile 3 | 53.521 |
| Decile 2 | 49.396 |
| Decile 1 | 39.848 |
| Minimum | 2.8094e-05 |
|

|
- Mean = 54.7117
- Std.dev = 13.9913
- 389 items above graph maximum of 91.42
|
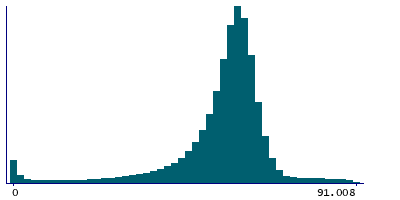
2 Instances
Instance 0 : Initial assessment visit (2006-2010) at which participants were recruited and consent given
467,515 participants, 467,515 items
| Maximum | 97.7793 |
| Decile 9 | 65.6081 |
| Decile 8 | 62.908 |
| Decile 7 | 61.117 |
| Decile 6 | 59.533 |
| Median | 57.926 |
| Decile 4 | 56.033 |
| Decile 3 | 53.494 |
| Decile 2 | 49.3499 |
| Decile 1 | 39.759 |
| Minimum | 2.8094e-05 |
|
|
- Mean = 54.6749
- Std.dev = 14.0135
- 371 items above graph maximum of 91.4573
|
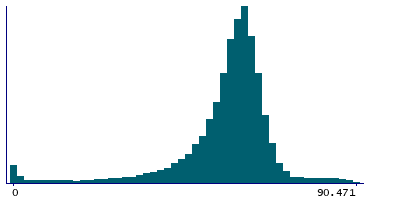
Instance 1 : First repeat assessment visit (2012-13)
19,105 participants, 19,105 items
| Maximum | 95.333 |
| Decile 9 | 66.2475 |
| Decile 8 | 63.538 |
| Decile 7 | 61.652 |
| Decile 6 | 60.1007 |
| Median | 58.4265 |
| Decile 4 | 56.614 |
| Decile 3 | 54.2261 |
| Decile 2 | 50.4461 |
| Decile 1 | 42.1421 |
| Minimum | 7.5396e-05 |
|
|
- Mean = 55.613
- Std.dev = 13.4043
- 25 items above graph maximum of 90.3529
|


