Data
503,466 items of data are available, covering 484,319 participants.
Defined-instances run from 0 to 1, labelled using Instancing
2.
Units of measurement are percent.
| Maximum | 45.8655 |
| Decile 9 | 20.341 |
| Decile 8 | 19.763 |
| Decile 7 | 19.3624 |
| Decile 6 | 19.026 |
| Median | 18.714 |
| Decile 4 | 18.394 |
| Decile 3 | 18.025 |
| Decile 2 | 17.4856 |
| Decile 1 | 16.272 |
| Minimum | 0.0020419 |
|
|
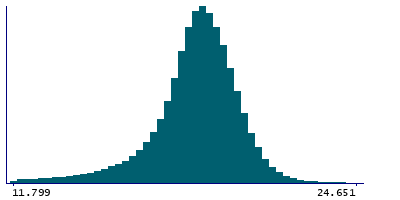
- Mean = 18.273
- Std.dev = 2.68433
- 15134 items below graph minimum of 12.203
- 624 items above graph maximum of 24.41
|
2 Instances
Instance 0 : Initial assessment visit (2006-2010) at which participants were recruited and consent given
483,759 participants, 483,759 items
| Maximum | 45.8655 |
| Decile 9 | 20.339 |
| Decile 8 | 19.762 |
| Decile 7 | 19.3628 |
| Decile 6 | 19.027 |
| Median | 18.715 |
| Decile 4 | 18.3961 |
| Decile 3 | 18.028 |
| Decile 2 | 17.489 |
| Decile 1 | 16.2747 |
| Minimum | 0.0020419 |
|

|
- Mean = 18.2732
- Std.dev = 2.68601
- 14604 items below graph minimum of 12.2104
- 601 items above graph maximum of 24.4034
|
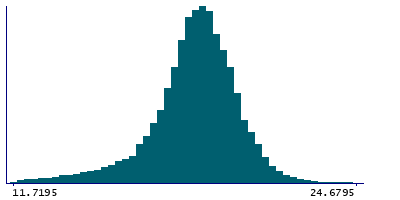
Instance 1 : First repeat assessment visit (2012-13)
19,707 participants, 19,707 items
| Maximum | 27.5351 |
| Decile 9 | 20.3865 |
| Decile 8 | 19.788 |
| Decile 7 | 19.3576 |
| Decile 6 | 19.0143 |
| Median | 18.684 |
| Decile 4 | 18.341 |
| Decile 3 | 17.953 |
| Decile 2 | 17.4056 |
| Decile 1 | 16.1965 |
| Minimum | 0.0063927 |
|
|
- Mean = 18.269
- Std.dev = 2.64268
- 523 items below graph minimum of 12.0065
- 20 items above graph maximum of 24.5765
|


